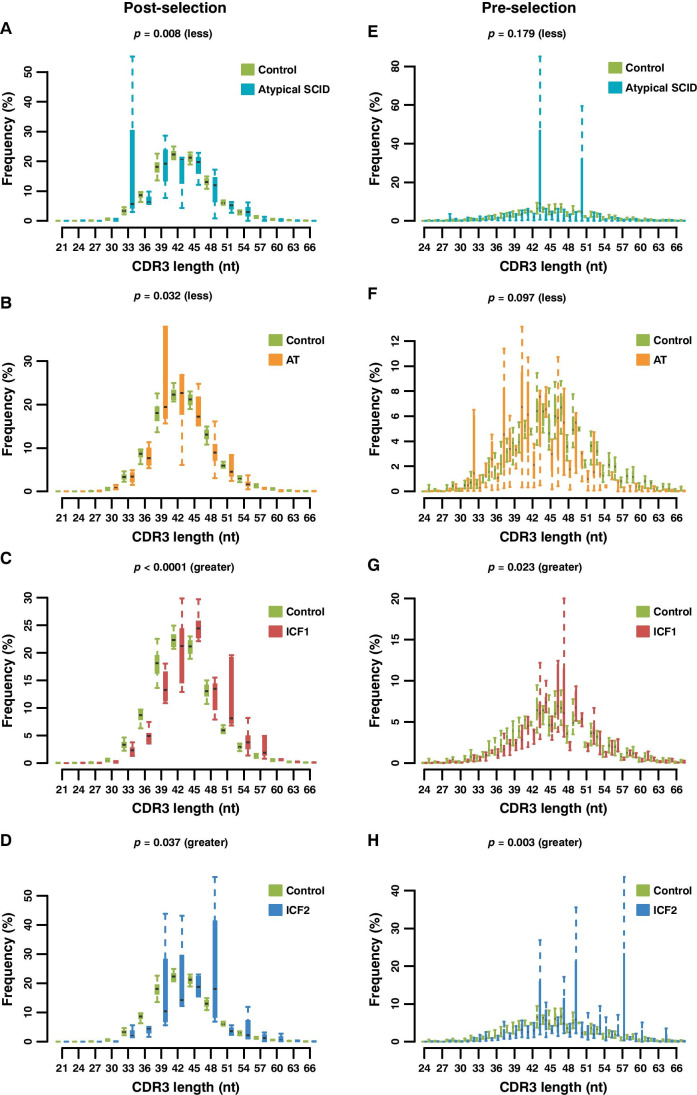
Fig. 2.
Distribution of the length of unique post-selection (in-frame, in nucleotides) and pre-selection CDR3 sequences (out-of-frame, in nucleotides). Distributions of in-frame CDR3 length show a bias toward shorter lengths in atypical SCID (A) and AT (B) patients and longer lengths in ICF1 (C) and ICF2 (D) compared to all normal samples. Similar results are observed in out-of-frame CDR3 length which present a bias toward either shorter lengths in atypical SCID (E) and AT (F) patients or longer lengths in ICF1 (G) and ICF2 (H) compared to healthy donors. One-sided Wilcoxon Rank Sum Test for the significance of length difference between each group pair

