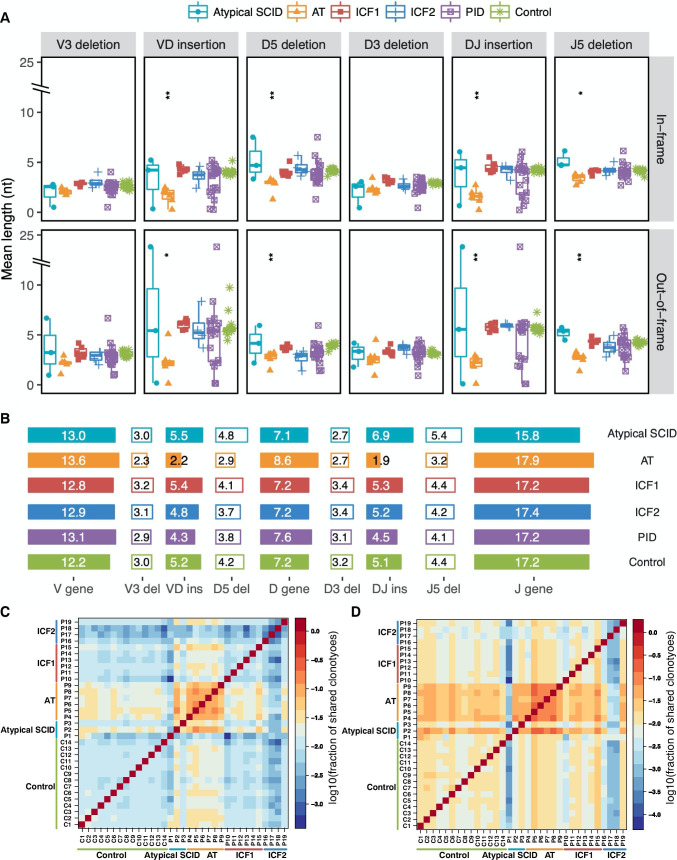
Fig. 3.
Altered InDel length distribution in DNA repair/methylation defect patient groups. A The length of 6 segments of 3’V, 5’D, 3’D and 5’J deletion, V-D and D-J insertion sequences of AT patients are shorter than healthy controls, both in out-of-frame or in-frame rearrangements. The reduction of insertion length is more remarkable than the length of deletion decrease. B Schematic diagram shows the average length of V, D, and J gene and InDel in different patient groups. C, D The heatmap represents fraction of shared unique (C) and total (D) CDR3 sequences within sample pairs, where the denominator is the average CDR3 sequence count of two samples. The asterisk above each group indicates the significance level of the differences between each group and normal controls (p ≤ 0.05 *, p ≤ 0.01 **, p ≤ 0.001 ***, p ≤ 0.0001 ****, two-sided Wilcoxon Rank Sum Test followed by false discovery rate control)

