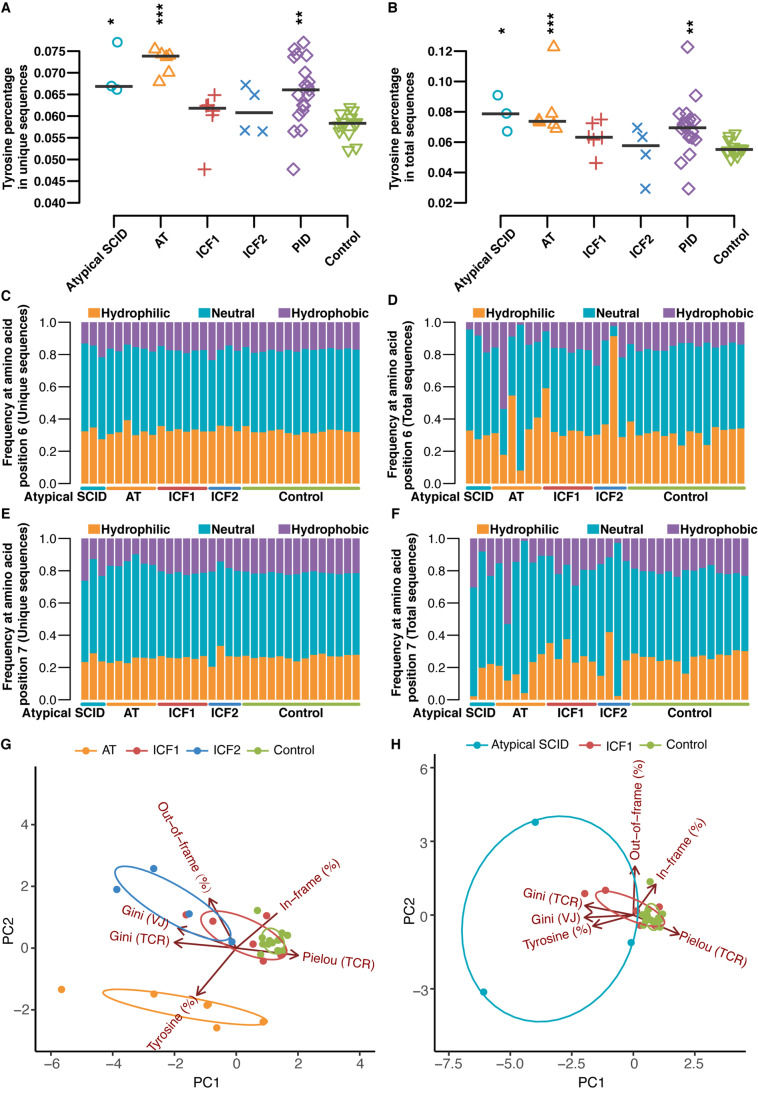
Fig. 4.
Abnormal amino acid composition of CDR3 in the TCRβ sequences. Percentage of tyrosine residues (Y-Index) in the CDR3 of unique (A) and total (B) sequences. Amino acid composition of CDR3 in patients and healthy controls for amino acid positions 6 (unique (C) and total (D)) and 7 (unique (E) and total (F)) of the 13-amino acid-long CDR-B3. Sample plots illustrating the segregation of the AT and ICF2 patient groups from healthy controls (G) whereas ICF1 and atypical SCID patient groups cannot separate from each other nor controls (H) based on principal component 1 (PC1) and PC2 based on six variables (Pielou’s evenness (TCR), Gini skewing index (TCR), Gini skewing index (V-J paring), the percentage of in-frame rearrangement, mean CDR3 length of out-of-frame rearrangement, and the percentage of tyrosine in unique clones. The asterisk above each group indicates the significance of tests between each group and normal controls (p ≤ 0.05 *, p ≤ 0.01 **, p ≤ 0.001 ***, p ≤ 0.0001 ****, two-sided Wilcoxon Rank Sum Test followed by multiple test correction)

