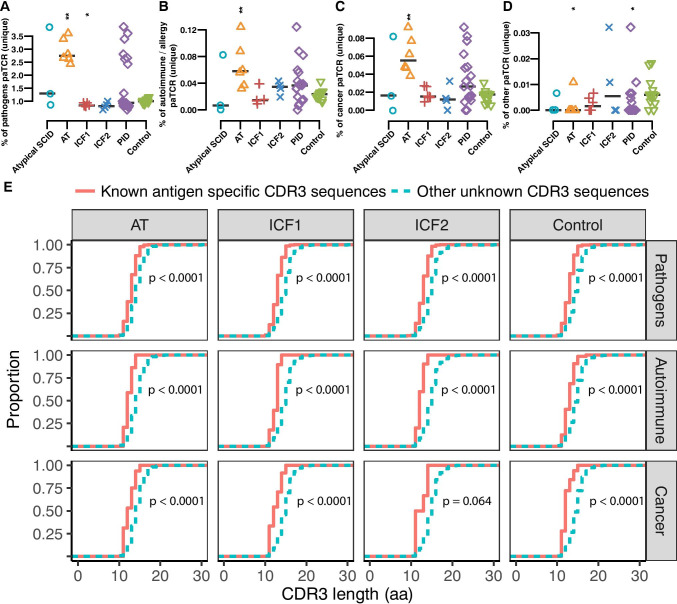
Fig. 5.
AT patients display a high percentage of pathology associated and common clonotypes. Proportion of literature reported pathology-associated TCR (paTCR) clonotypes in unique CDR3 sequences in each patient group (A–D). AT patients have higher percentage of pathogens (A), autoimmune and allergy (B), cancer (C) associated and low percentage of other (D) reported TCR clones, whereas ICF1 and ICF2 patients have a low percentage of pathogen-associated clonotypes. E CDR3 length distribution in known pathology-associated TCR and unknown clonotypes (one-sided bootstrapped Kolmogorov–Smirnov test). The asterisk above each group indicates the significance of tests between each group and normal controls (p ≤ 0.05 *, p ≤ 0.01 **, p ≤ 0.001 ***, p ≤ 0.0001 ****, two-sided Wilcoxon Rank Sum Test followed by false discovery rate control)

