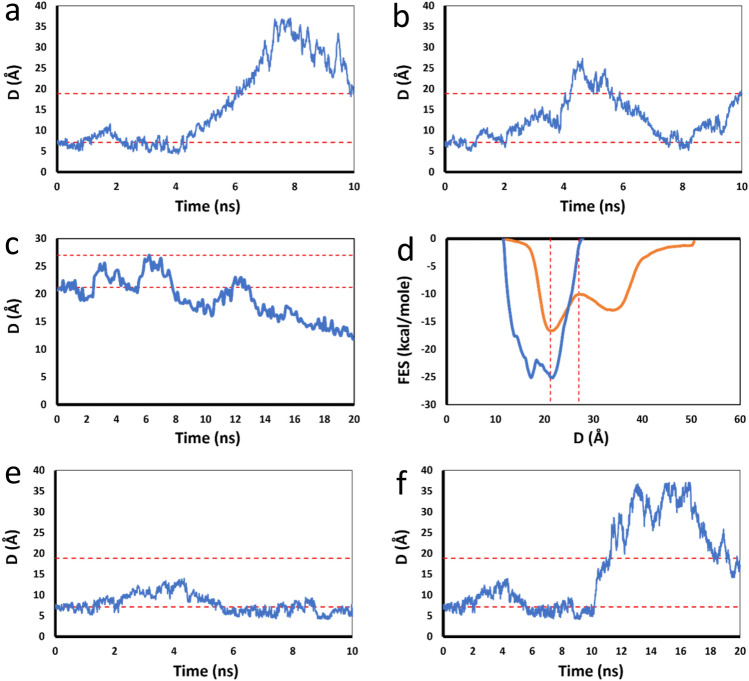
Figure 3.
Examination of each run against one-way trip description. (a) D versus Time plot of a one-way trip run in which the sampling initially stays around r0 (lower-level dotted red line), and then goes up passing through rb (higher-level dotted red line) without returning back to the level around r0. (b) D versus Time plot of a multi-trip run in which the sampling goes up passing through rb and then returns back to the original level around r0. (c) D versus Time plot of a run where D goes toward opposite direction of dissociation signaling invasions, conformational changes or other movements unrelated to the dissociation. (d) Average FES (orange curve) and the primitive FES (blue curve) corresponding to the run in panel (c). The primitive FES of this run invades the “inner” region, left to the left wall of the primary minimum of the average FES. (e) D versus Time plot of a run that stays in the bound state because the simulation time is not long enough. (f) D versus Time plot after the run in panel e is extended to longer simulation time, showing a one-way trip behavior.

