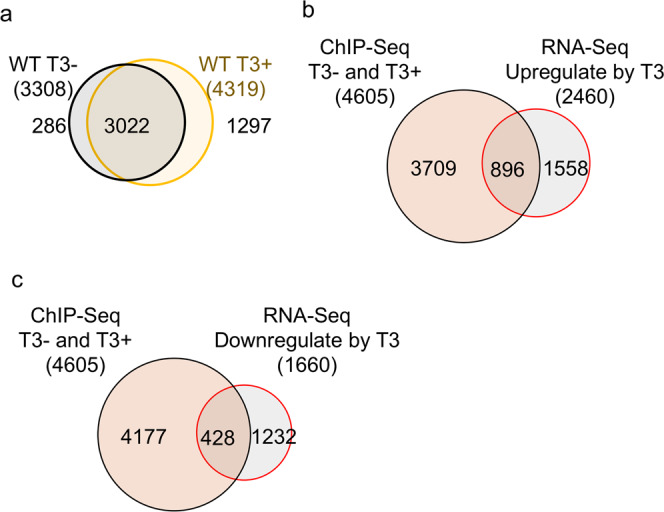
Fig. 1. Most TR-bound genes found by ChIP-Seq are bound by TR constitutively in the wild-type intestine and many are upregulated by T3.

a Venn diagram of the TR target genes identified by ChIP-Seq in wild-type intestine with or without T3 treatment. The 3308 and 4319 TR-bound genes were identified from the 11,469 and 17,930 ChIP-seq peaks present in all three replicates of the −T3 and +T3 samples, respectively, based on the presence of TR-binding peak(s) in the coding region (including the introns) and/or 5 kb upstream or downstream of the cording region. Those peaks that could not be assigned to any known genes are indicated as “NA or Not Annotated” in Supplementary Data 1. Note that most genes were bound by TR constitutively. b Venn diagram showing overlap between the TR-bound genes identified by ChIP-Seq and T3-upregulated genes in the intestine based on previous RNA-seq study except using Xenbase for gene annotation and a cutoff of 1.5 fold regulation (cut-off threshold, FDR < 0.05)19. Of the 4605 TR-bound genes identified by ChIP-Seq, 19% were shown as the T3-upregulated genes. Conversely, 36% of the T3-upreguated genes were found to be TR-bound. c Venn diagram showing overlap between the TR-bound genes identified by ChIP-Seq and T3-downregulated genes in the intestine based on previous RNA-seq study except using Xenbase for gene annotation and a cutoff of 1.5 fold regulation (cut-off threshold, FDR < 0.05)19. Of the 4605 TR-bound genes identified by ChIP-Seq, 9% were shown as the T3-downregulated genes. Conversely, 26% of the T3-downreguated genes were found to be TR-bound.
