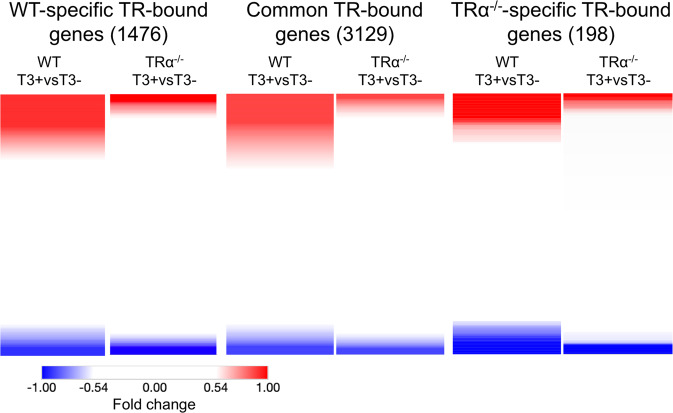
Fig. 5. T3 regulation profile of ChIP-Seq detected genes.
Heatmap showing the fold change of gene expression in wild-type or TRα−/− intestine after 18 h T3 treatment as measured by RNA-Seq19, for TR-bound genes detected by ChIP-Seq in only the wild-type intestine (left), both wild-type and TRα−/− intestine (middle) or only TRα−/− intestine (right). Note that higher fractions of the TR-bound genes were upregulated (red) or downregulated (blue) by T3 were present in the wild-type-specific or common TR-bound genes than TRα−/−-specific TR-bound genes and that TRα knockout reduced T3-regulation, i.e., leading to lighter red or blue, for individual genes, suggesting that TRα−/− is important for gene regulation during the treatment. Note that the blank region between the red and blue areas are genes whose expression has no or little change after T3 treatment of wild-type or TRα knockout animals. The color range shows fold changes in log2 scale.

