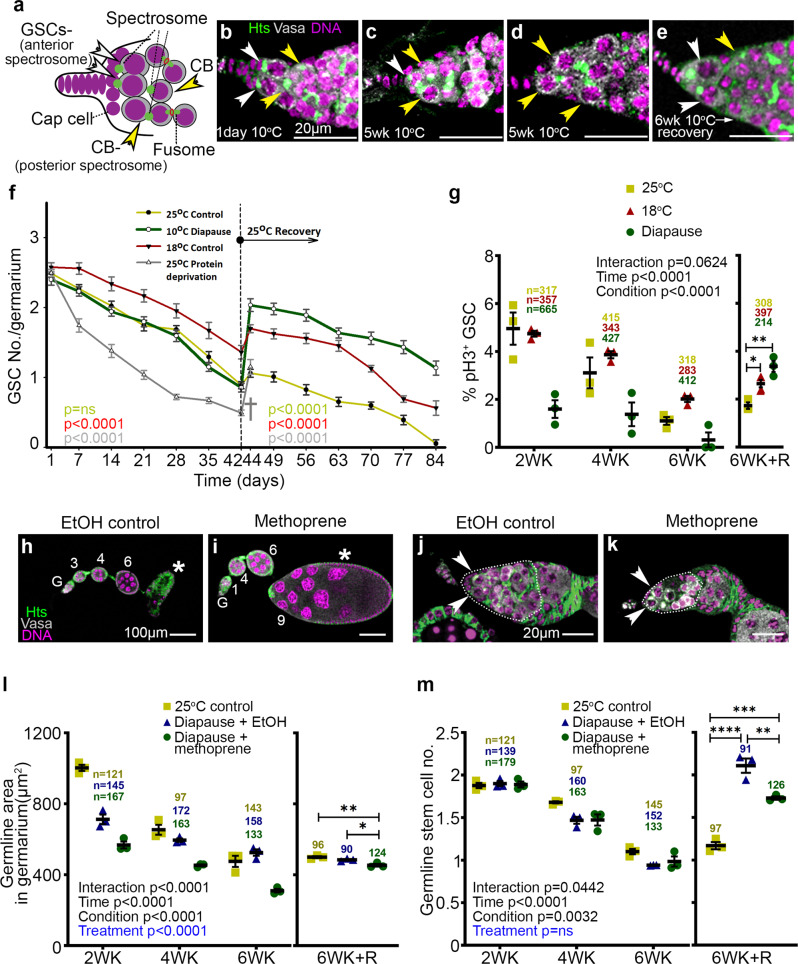
Fig. 3. Germline stem cells in diapause arrest and recovery.
a Schematic of a germarium tip showing GSCs (white arrowheads) in contact with niche cap cells and containing an anterior (left) spectrosome and a cystoblast (yellow arrowhead) with a posterior spectrosome and/or separated from the niche. b–e Confocal micrographs of representative germaria from diapause and recovery are stained with Vasa (white), Hts (green), and Hoechst (magenta). Nondiapause germaria are shown in Supplementary Fig. 3a–d. Scale bars 20 µm. f Quantification of GSC numbers over six weeks in the indicated conditions (control, diapause, protein deprivation) followed by 6 weeks at 25 °C. GSC numbers declined during diapause (green line) and rebounded during recovery. Protein deprivation led to premature death (†) so GSC data were not available after 44 days. Data = mean ± s.e.m. and refer to Supplementary Fig. 3e which has the n, number of germaria analyzed. p value for the condition was calculated using 2-way ANOVA (carried out separately for before and after the recovery time period) individually for each condition. g Percentage of GSCs in mitosis, assessed using anti-pH3 staining, over six weeks (WK) in the indicated conditions, followed by recovery (R). (n) number of GSCs analyzed. *p = 0.0179; **p = 0.0011. h, i Representative images of ovarioles without (EtOH control) or with methoprene treatment. G, germarium. Numerals indicate egg chamber stages. The stage 7/8 diapause arrest (asterisk in (h)) was released by methoprene treatment allowing the development of vitellogenic egg chambers (asterisk in (i)). j, k Arrowheads indicate GSCs. Dotted lines outline germarium regions 1 and 2, which are quantified in (l) (*p = 0.0265; **p = 0.0040). See also Supplementary Fig. 3. m Quantification of GSC numbers over time. **p = 0.0069; ***p = 0.0010; ****p < 0.0001. (n) number of germaria analyzed in (l, m). For g, l, m, data = mean ± s.e.m. Statistical analysis is by 2-way ANOVA before recovery and 1-way ANOVA with Tukey’s multiple comparisons test after recovery.

