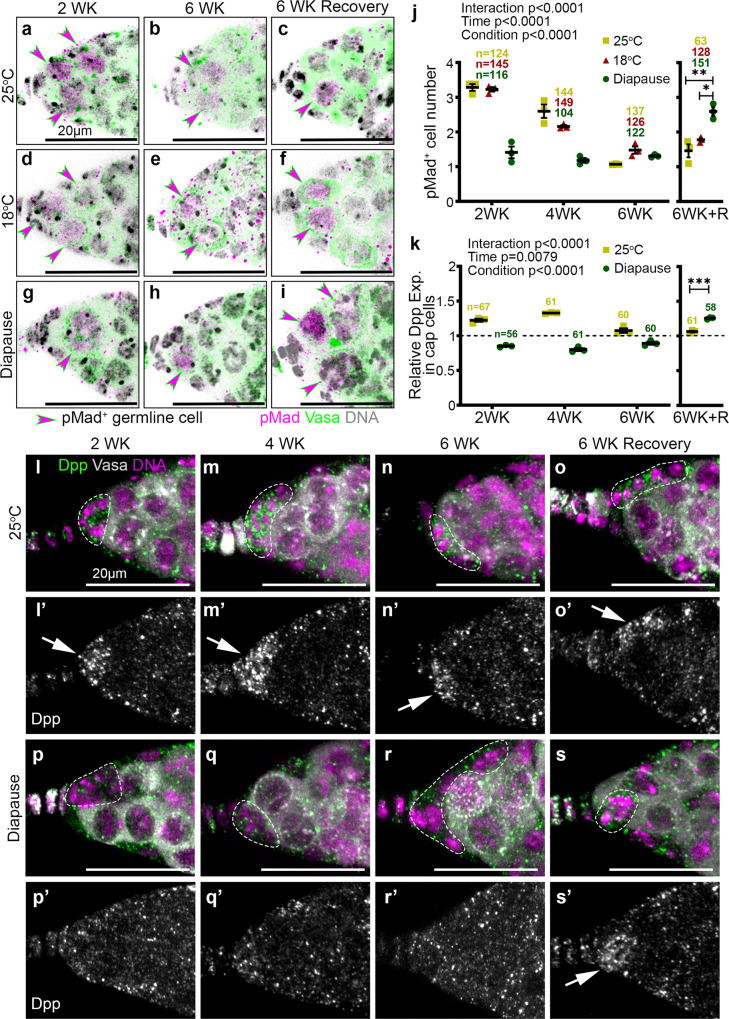
Fig. 6. GSC niche signaling in diapause and recovery.
a–i Confocal micrographs of germaria stained for pMad (magenta), Vasa (green), and Hoechst (gray) from flies maintained at 25 °C, 18 °C or in diapause. pMad+ cells are marked by magenta arrowheads. j Quantification of pMad+ germline cells over time from flies maintained at 25 °C, 18 °C, or in diapause. k Quantification of Dpp signaling in the cap cells relative to that in the germline region. l–s Confocal micrographs of germaria stained for Dpp (green) to identify the BMP signaling from the cap cells, along with Vasa (gray), and Hoechst (magenta) from flies maintained at 25 °C (l–o) or in diapause conditions (p–s) for 2, 4, 6, or 6 weeks (WK) followed by recovery. Cap cells are marked in dotted lines. (l’–s’) Dpp channel alone is in gray and Dpp enrichment in the cap cell region is shown with arrows. n = number of germaria analyzed. Data are mean ± s.e.m. from at least three independent experiments. Statistical analysis was carried out by two-way ANOVA before recovery time periods in (j, k). After recovery, ordinary 1-way ANOVA with Tukey’s multiple comparisons test for (j) and unpaired two-tailed t-test for (k) were undertaken (*p = 0.0119; **p = 0.0024; ***p = 0.0002). Scale bars are 20 µm. See also Supplementary Fig. 6.

