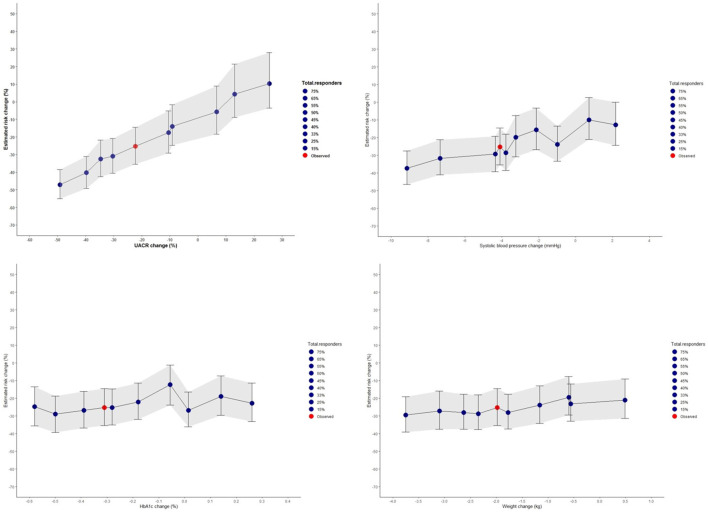
FIGURE 6.
Simulated risk marker changes and the effect on the composite kidney and cardiovascular death outcomes for the prospective EMPA-KIDNEY trial based on the selected EMPA-REG OUTCOME trial population. The shaded area indicates the 95% confidence intervals for the simulated risk marker changes. Risk prediction was estimated from short-term risk marker changes in the EMPA-KIDNEY population (N = 1222) chosen from the EMPA-REG OUTCOME trial, and simulated values for UACR, systolic blood pressure, HbA1c, and body weight. The red dot indicates the PRE score predicted risk change in the EMPA-KIDNEY trial without enrichment with responders. The blue dots represent changes observed in the different proportion of responders and non-responders for each risk marker. HbA1c, glycated hemoglobin; UACR, urinary-albumin-to-creatinine ratio.

