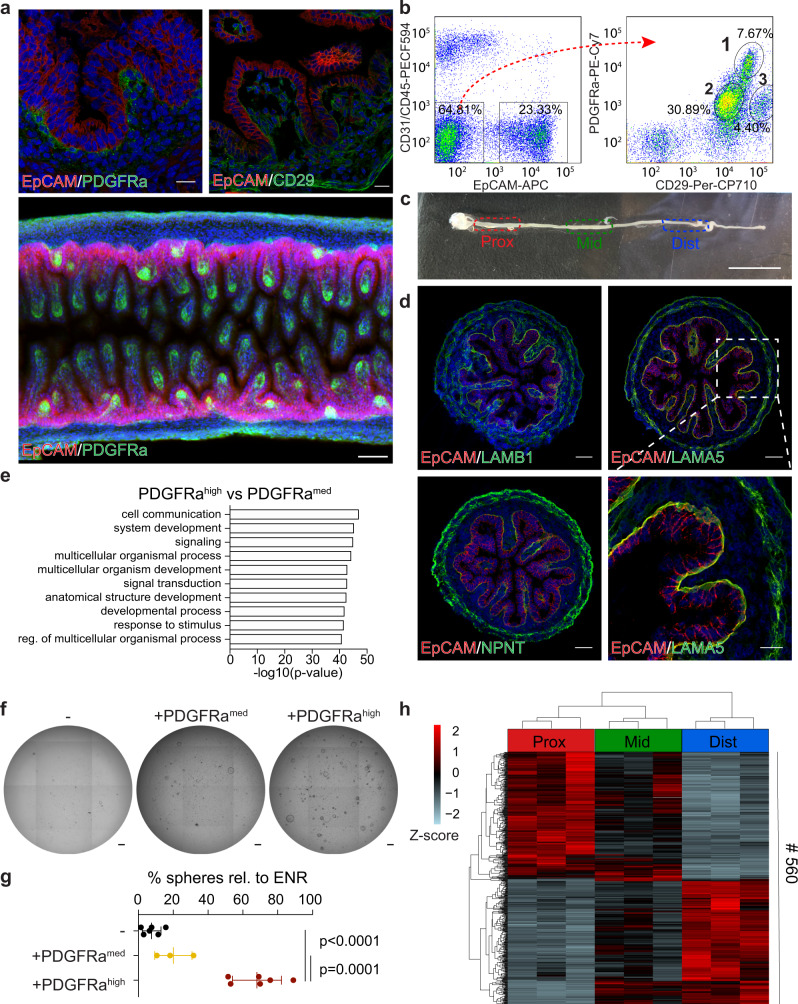
Fig. 1. Subepithelial PDGFRahigh cells support the growth of fetal epithelium and possess region-specific transcriptional profiles.
a Detection of EpCAM (red), DAPI (blue) and PDGFRa (green, left and lower panel) or CD29 (green, right) at E16.5. Lower panel is 3D-rendered image of a representative SI. Scale bars, 20 μm (upper panels) and 50 μm (lower panel). b FACS profile showing the distribution of DAPI−/CD31−/CD45− parenchymal cells according to their EpCAM (left) and PDGFRa/CD29 (right) profile. c Overview of E16.5 SI and the division into proximal (prox), mid and distal (dist) regions. Scale bar, 1 mm. d Detection of EpCAM (red), DAPI (blue) and LAMB1 (green, upper left), LAMA5 (green, upper right and lower right), or NPNT (green, lower left) at E16.5. Scale bars, 50 μm except lower right, where scale bar, 20 μm. e GO-term enrichment analysis showing top 10 terms in the Biological Process category comparing PDGFRahigh and PDGFRamed cells (intersect of pairwise tests as presented in Supplementary Fig. 2a). f, g Formation of organoids from DAPI−/CD31−/CD45−/EpCAM+ cells isolated from the proximal 20% of the E16.5 SI cultured with PDGFRamed (middle) or PDGFRahigh cells (right) without ENR in basal medium. Percentage of spheres were calculated relative to organoid formation in basal medium with ENR. Scale bars, 100 μm. h RNA-seq of PDGFRahigh cells depicting the 560 differentially expressed genes comparing proximal, mid and distal regions. Results in a–d and f are representative of at least n = 3 independent experiments. h presents RNA-seq data from n = 3 biological replicates collected in independent experiments. Data presented in g are means ± s.d. from n = 6 independent experiments for EpCAM+ and EpCAM++PDGFRahigh cultures and n = 3 independent experiments for EpCAM++PDGFRamed cultures. Statistical significance was assessed using one-way ANOVA test. Figure e presents results from GO enrichment test using goana.

