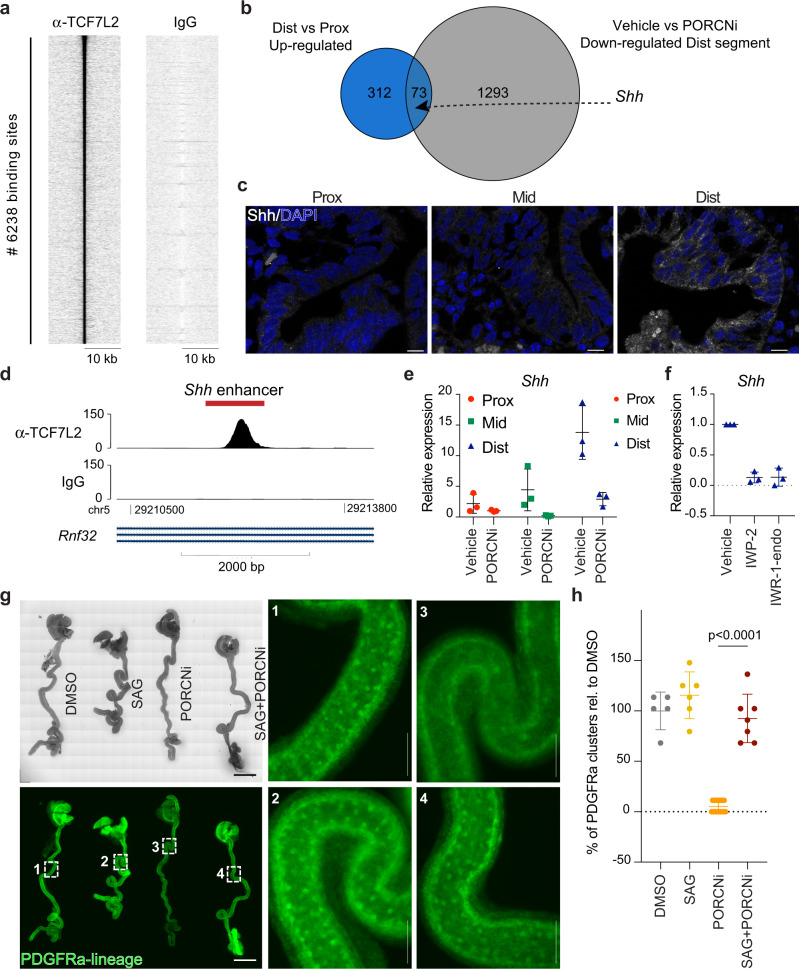
Fig. 4. Wnt signalling regulates Shh expression in the developing distal SI.
a Heatmap showing enrichment of ChIP-seq tags over the 6238 identified TCF7L2 binding sites (±10 kb). b Euler diagram showing the overlap between the 385 genes upregulated comparing distal versus proximal E16.5 SI EpCAM+ cells (see also Supplementary Fig. 2d) and the 1366 genes down-regulated in control-treated relative to PORCN-inhibited distal regions (see also Fig. 3c). c Detection of SHH (white) and DAPI (blue) at E16.5. Scale bars, 20 μm. d ChIP-seq track depicting TCF7L2 coverage at the MACS1 Shh enhancer region (chr5:29211998-29212804, marked in red) in SI EpCAM+ cells. e qPCR analysis for Shh using intestinal biopsies from E16.5 embryos. f qPCR analysis for Shh using established organoid cultures from E16.5 distal SI cultured in ENR and treated with Vehicle, 5 μM IWP-2, or 10 μM IWR-1-endo for 24 h. g Fetal whole intestine culture depicting cluster formation in PDGFRaCreERT2;mTmG mice following DMSO (1), 1 μM SAG (2), 1 μM PORCNi (3) or SAG+PORCNi (4) treatment. Scale bars, 2 mm (overview) and 275 μm (enumerated panels). h Quantification of the number of PDGFRa+ clusters. Results in e represent n = 3 biological replicates, and results in f represent n = 3 independent experiments. Results in h are derived from two independent litters of embryos where in total 4 (DMSO), 5 (SAG), 4 (PORCNi) and 6 (SAG+PORCNi) whole intestines were cultured. The data-points represent n = 5 (DMSO), n = 6 (SAG), n = 13 (PORCNi) and n = 7 (SAG+PORCNi) analysed images. Statistical significance was assessed using one-way ANOVA test. Graphs show means ± s.d.

