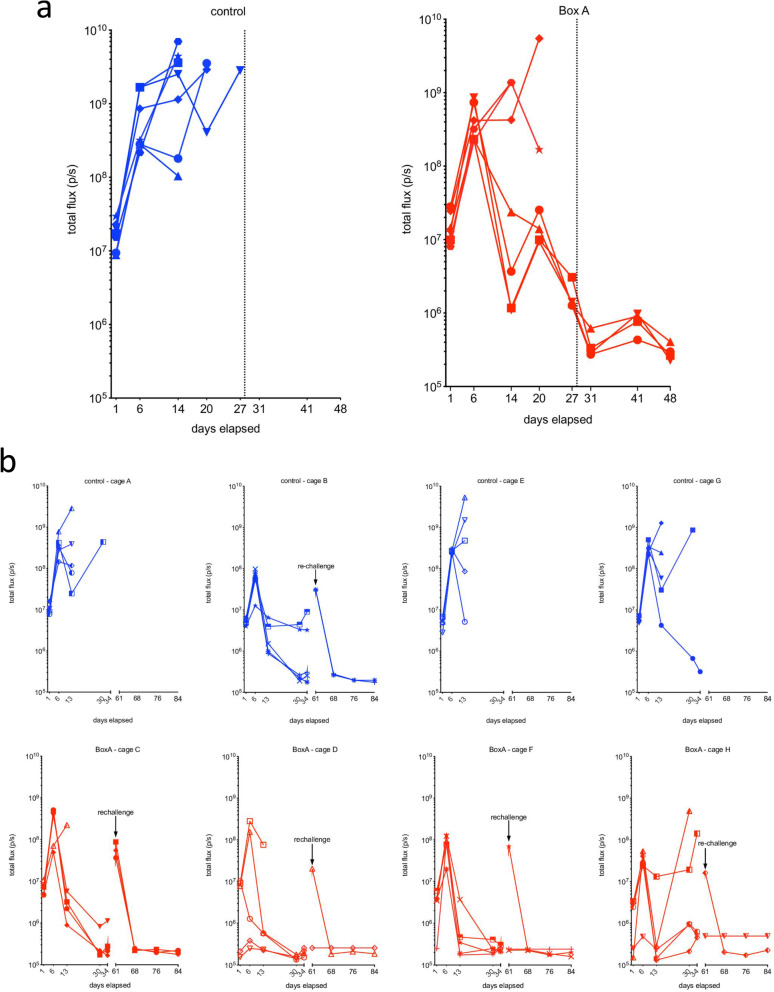
Fig. 3.
OI curves in the first and second experiments. a In the first experiment, phosphate-buffered saline-treated mice (blue line) were studied at five timepoints with OI, after which all mice had been sacrificed. BoxA-treated mice (red line) were studied for 8 timepoints, since 4 out of 7 had survived. In the control mice from the first to the last OI acquisition, there was an increase of the signal for the growth of tumor cells’ masses due to a significant tumor progression. In BoxA-treated mice that did not survive, tumor progression was as observed in control mice, whereas in the surviving mice we did not observe any tumor onset. b In the second experiment, both control (blue line) and BoxA-treated mice (red line) were initially studied for 5 timepoints. The results were similar to those showed in panel a, in that most control mice and a fraction of BoxA-treated mice developed tumors, whereas the surviving mice did not. At day 61, two controls and 6 BoxA-treated mice were rechallenged with murine MM cells and studied by OI for another 12 days in which remained tumor-free

