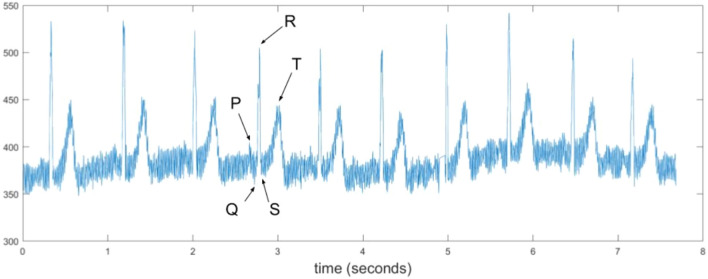
Figure 4.
Sample single-lead EKG tracing with the P (atrial depolarization), QRS (ventricular depolarization) and T (ventricular repolarization) waves labelled. Note that the heart rate in this sample can be calculated from the R–R distance, which is approximately four heartbeats in three seconds or 80 beats per minute.

