Figure 1.
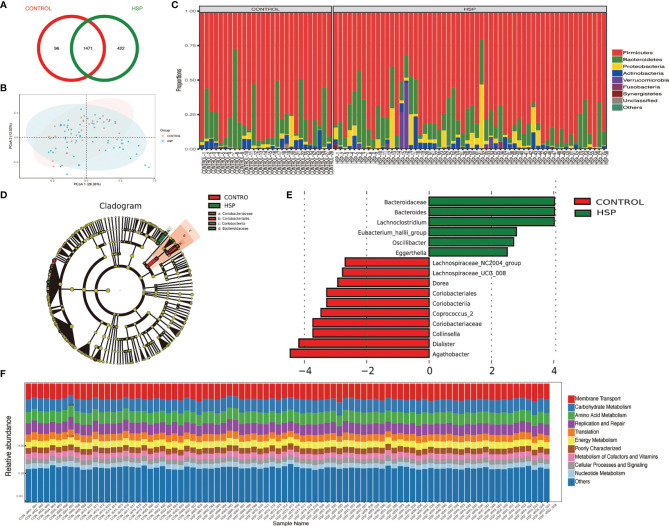
Intestinal dysbiosis between HSP group and control group. (A) Venn diagram of OTU distribution in HSP group and control group. (B) PCoA analysis between HSP group and control group. (C) Histogram of the distribution of intestinal flora in the HSP group and control group at the phylum level. (D) LDA evolutionary branch diagram by LEfSe analysis. (E) Intestinal flora LEfSe analysis diagram (LDA >2, p < 0.05). (F) KEGG function prediction of intestinal microbes in two groups.

