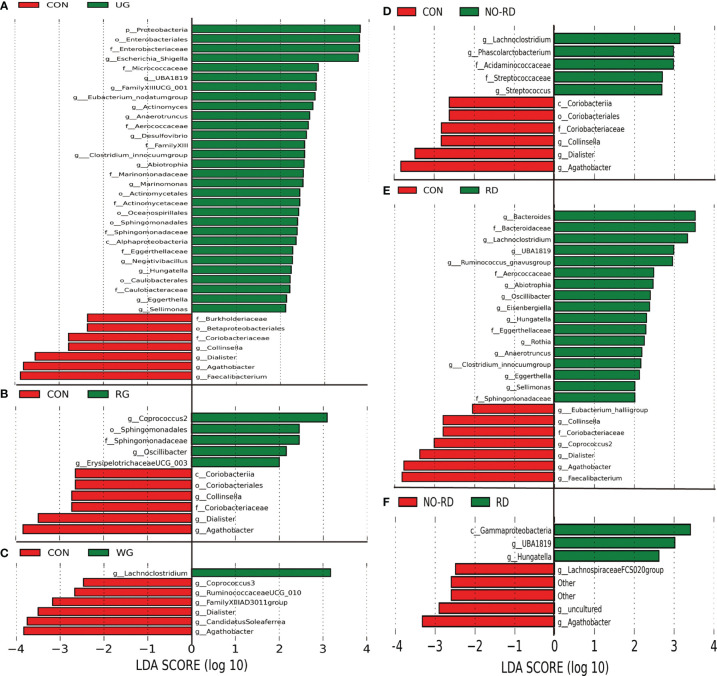
Figure 2.
Differences in intestinal flora among the subgroups of HSP and healthy group. (A) Intestinal flora LEfSe analysis diagram between the untreated group (UG) and control group (CON). (B) Intestinal flora LEfSe analysis diagram between the regular treated group (RG) and control group (CON). (C) Intestinal flora LEfSe analysis diagram between the withdrawal group (WG) and control group (CON). (D) Intestinal flora LEfSe analysis diagram between the no renal damage group (NO-RD) and control group (CON). (E) Intestinal flora LEfSe analysis diagram between the renal damage group (RD) and control group (CON). (F) Intestinal flora LEfSe analysis diagram between the no renal damage group (NO-RD) and renal damage group (RD). All LDA >2, p < 0.05.

