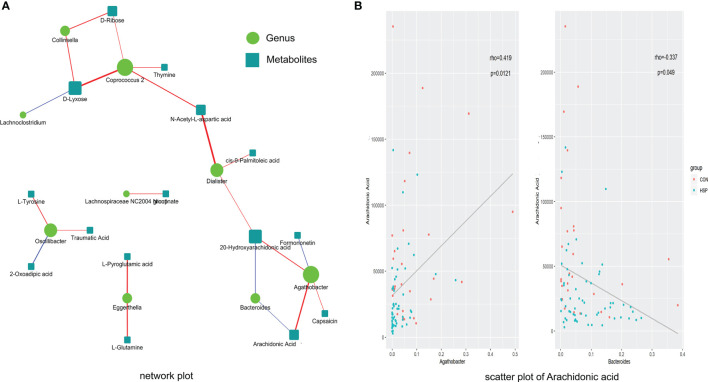
Figure 5.
Spearman correlation between significantly different intestinal microbes and metabolites. (A) Spearman correlation analysis network diagram of significant difference flora and significant metabolites. Red lines mean positive correlation and blue lines mean negative correlation. The darker the color, the stronger the correlation. (B) Scatter plot of AA with Agathobacter (left) and Bacteroides (right).

