Figure 1.
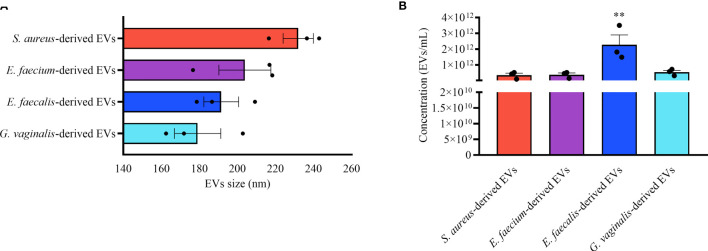
Bacterial EV-size and concentration. Nanoparticle tracking analysis of EVs derived from S. aureus, E. faecium, E. faecalis, and G. vaginalis. (A) EV-sizes expressed as mean ± SEM of particle diameter (nm). (B) Mean ± SEM of the EV concentration (particles/mL). Presented are the results of three independent measurements. **p < 0.01.

