Figure 3.
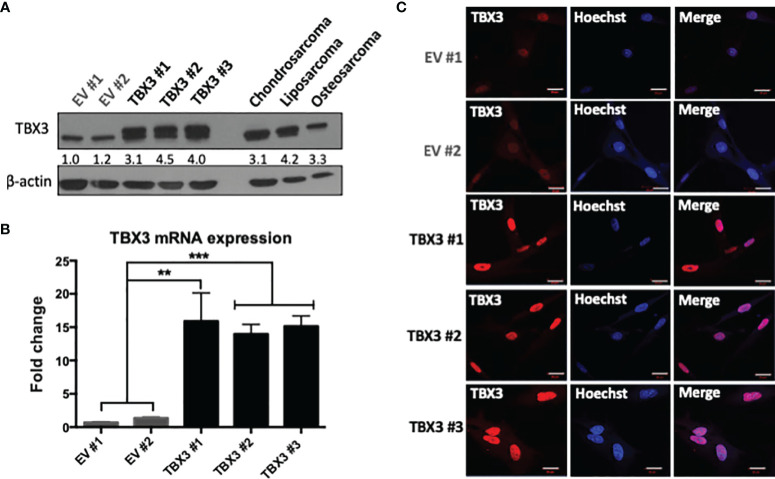
Establishment of stable TBX3 overexpressing hMSCs. (A) Western blot analysis shows levels of TBX3 in EV and TBX3 hMSCs, chondrosarcoma (SW1353), liposarcoma (SW872) and osteosarcoma (SaOS-2) cells. β-actin was used as a loading control. Densitometry readings were obtained using Fiji and protein expression of total TBX3 levels (endogenous + FLAG-tagged) are represented as a ratio of protein of interest/β-actin normalized to EV #1. (B) qRT-PCR analysis shows levels of TBX3 mRNA in EV and TBX3 hMSCs. Student’s t-test was used to compare between groups, **p < 0.01; ***p < 0.001; error bars represent mean ± SEM. (C) Representative confocal immunofluorescence images (630X; Carl Zeiss LSM 510, scale bars = 20 µm) of EV and TBX3 hMSCs. TBX3 was detected with a fluorophore conjugated Cy3 secondary antibody. Cells were co-stained with Hoechst to determine nuclei location and 20 fields of view were visualized (n=3, for all panels).

