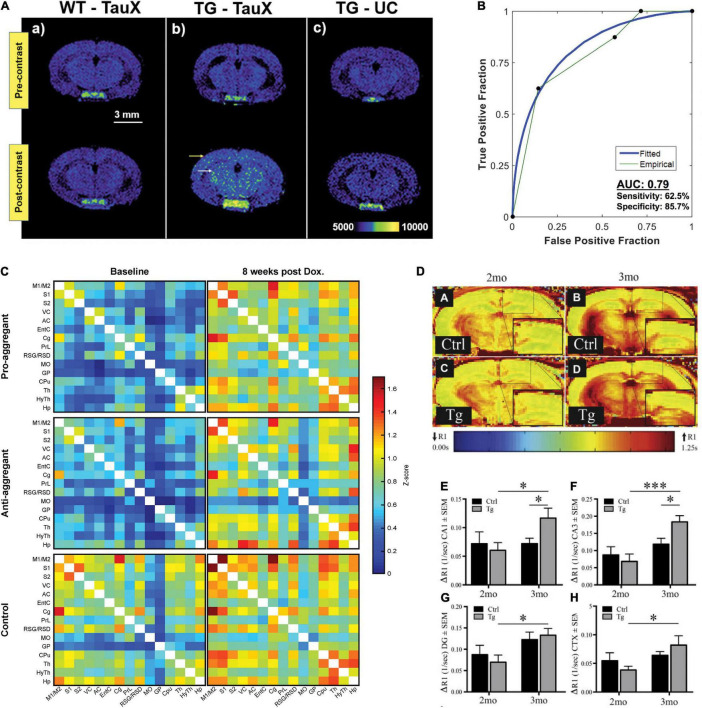
FIGURE 1.
Tau accumulation and functional imaging in tauopathy mouse models. (A,B) Tau imaging. (A) T1-weighted spin-echo images demonstrate signal enhancement in delayed post-contrast scans of transgenic P301S mice treated with TauX but not in age-matched controls. Wild-type animals showed no signal enhancement 4 days after the administration of TauX. Transgenic animals show high enhancement in the cortical (yellow arrow) and hippocampal regions (white arrow) 4 days after the administration of TauX. Transgenic animals showed no signal enhancement 4 days after the injection of untargeted contrast. Scale bar represents 3 mm. All animals are shown on the same color bar scale. (B) Receiver operating characteristic curve demonstrating TauX accuracy in identifying early age transgenic animals. Area under the curve is calculated using the empirical curve. Sensitivity describes the true positive rate for transgenic mice given TauX, while specificity is the true negative rate for wild-type mice given TauX and transgenic mice receiving untargeted gadolinium nanoparticle contrast. Reproduced from Badachhape et al. (2020) with permission from Elsevier. (C) Functional connectivity matrices of transgenic rTg4510 and wild-type mice at baseline and after 8weeks of treatment with doxycycline. The pro- and anti-aggregant mice clearly show matrices of lower z score values at baseline (left column). Upon 8weeks of doxycycline treatment (right column), the z score values of the transgenic animals closely approximate those of the control group. Reproduced from Green et al. (2019) with permission from Springer Nature. (D–H) MEMRI-R1 detects early signs of neuronal dysfunction in transgenic rTg4510 mice before the onset of cognitive deficits. (D, A–D) Representative R1 map of (A) 2-month littermate control, (B) 3-month littermate control, (C) 2-month rTg4510 mouse (Tg), and (D) 3-month rTg4510 mouse (Tg). Quantification of ΔR1 values in (E) CA1, (F) CA3, (G) dentate gyrus, and (H) superior medial cortex. All values are mean ± SEM, n = at least 4. ***p < 0.001, *p < 0.05. Reproduced from Fontaine et al. (2017) with permission from Elsevier. CA1, cornu ammonis 1; CA3, cornu ammonis 3; CTX, cortex; DG, dentate gyrus; MEMRI, manganese-enhanced magnetic resonance imaging.

