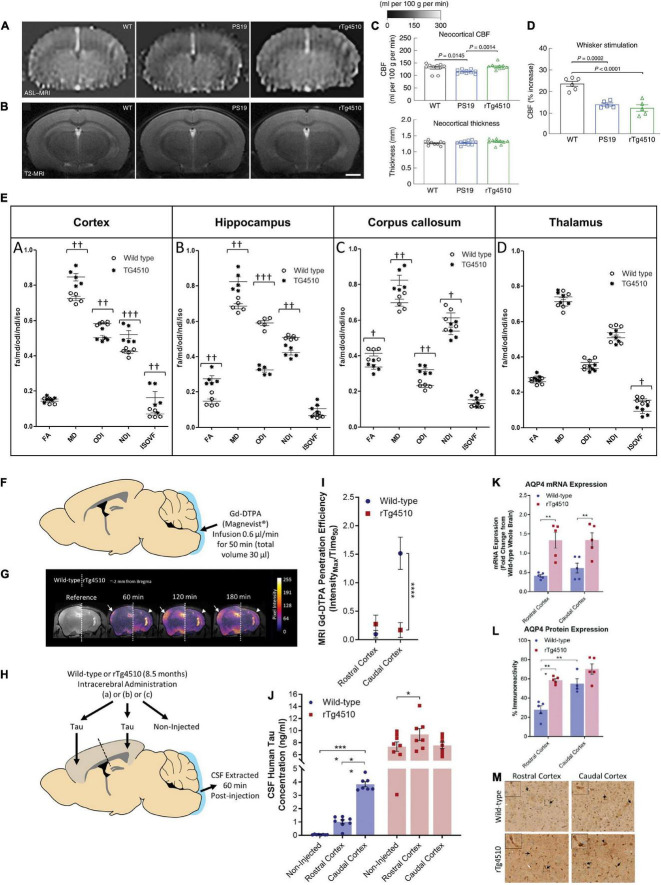
FIGURE 2.
Reduced cerebral blood flow, white matter integrity, glymphatic inflow, and clearance of Tau in rTg4510 mice. (A), Neocortical CBF, as assessed by ASL–MRI [representative images on the left, quantification in (C)], shows no reduction in 2–3-month-old rTg4510 mice and a small reduction in 2–3-month-old PS19 mice compared with age-matched WT mice. N = 10 mice per group; one-way ANOVA with Tukey’s test for multiple comparisons. (B) Neocortical thickness, as assessed bilaterally in T2-weighted MRI [images (representative images on the left, quantification in (C)] at the level of the somatosensory cortex (-1.22—1.70mm from bregma), is comparable in PS19, rTg4510, and WT mice. Scale bar, 1mm. N = 10 mice per group. (D) The increases in CBF induced in the whisker barrel cortex by mechanical stimulation of facial whiskers (N = 5 mice per group; one-way ANOVA with Tukey’s test) were markedly attenuated in both PS19 and rTg4510 mice compared with WT mice. Reproduced from Park et al. (2020) with permission from Springer Nature. (E) Neurite orientation dispersion and density imaging for white matter integrity assessment. Region-of-interest quantification of fractional anisotropy, mean diffusivity (× 10– 9 m2/s), orientation dispersion index, neurite density index, and isotropic volume fraction for each animal based on distinct anatomical regions. (A) Cortex, (B) hippocampus, (C) corpus callosum, and (D) thalamus († = p < 0.05, †† = p < 0.01, ††† = p < 0.001). Reproduced from Colgan et al. (2016) with permission from Elsevier. (F) Schematic illustrating infusion of Gd-DTPA into the cisterna magna of the mouse for quantification of glymphatic inflow in the brain. (G) Representative pseudocolor scaled coronal (approximately -2 mm from bregma) images of the (left) wild-type and (right) rTg4510 mouse brain, highlighting the difference in the extent of contrast agent infiltration into the caudal cortex [designated by white arrows (wild-type) and arrowheads (rTg4510)] over time. This difference is further exemplified through the calculated Gd-DTPA penetration efficiency data shown in (I). (H) Schematic illustrating brain homogenate injection experiments in which tau-containing brain homogenate was injected into either the rostral or caudal cortex of wild-type and rTg4510 mice, and CSF was extracted from the cisterna magna 60 min later. (J) Tau concentration of CSF samples extracted from experiments shown schematically in d demonstrating reduced clearance from the caudal cortex of rTg4510 mice compared with wild-type animals. Raw data and mean ± SEM between animals shown in d, and best-fit value and associated 95% CI of sigmoidal fitting of data shown in c. n = 5–8 per group. Statistical significance is denoted by asterisks: **p < 0.01, ****p < 0.0001. AQP4 expression and polarization in rTg4510 mice. Quantification of (K) mRNA and (L) protein expression of AQP4 in the rostral and caudal cortex of wild-type and rTg4510 mice, demonstrating upregulation in rTg4510 mice compared with wild-type controls. (M) Representative example images of brain tissue from wild-type and rTg4510 mice immunohistochemically stained for AQP4. Arrows indicate examples of immune-positive blood vessels in each image, which are shown at greater magnification in insets. Reproduced from Harrison et al. (2020) with permission from the Oxford press. AQP4, aquaporin 4; CSF, cerebrospinal fluid; FA, fractional anisotropy; Gd-DTPA, gadolinium diethylenetriaminepentaacetic acid; IsoVF, isotropic volume fraction; MD; mean diffusivity, NDI, neurite density index; NODDI, neurite orientation dispersion and density imaging; ODI, orientation dispersion index; WT, wild-type.

