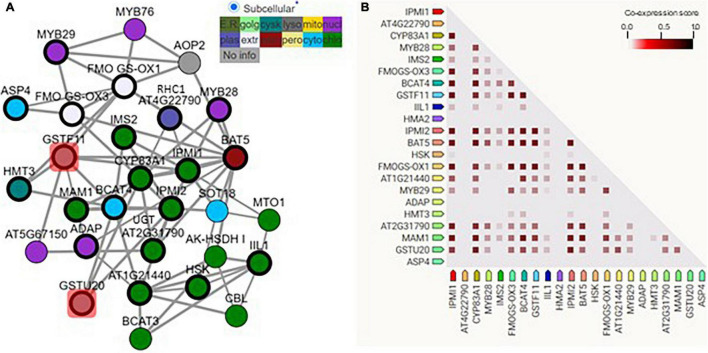
FIGURE 1.
GSTF11/U20 correlated with glucosinolate (GSL) biosynthesis genes. (A) The regulatory network of GSTF11/U20 with genes involved in the biosynthesis of aliphatic GSLs. GSTF11/U20 are highlighted by red squares connected with several detected aliphatic GSL genes. The genes present in the network image are listed in Supplementary Table 1. Different color nodes represent the predicted or experimental subcellular information of each gene. (B) Co-expression strength predicts the functional association between GSTF11/U20 and aliphatic GSL genes. The intensity of the color in the triangle matrices indicates the level of confidence that two proteins are functionally associated, and more confidence was noted when the score approached 1.

