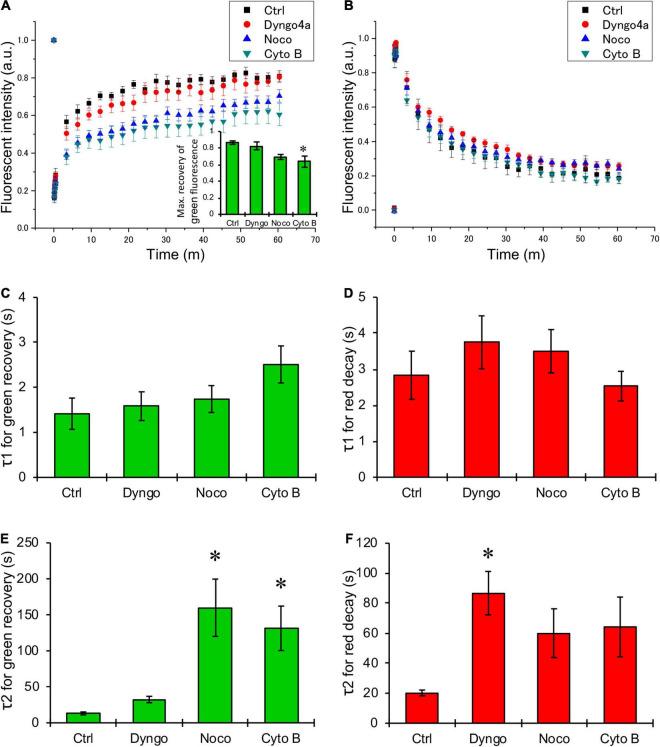
FIGURE 3.
Quantification of changes in green and red fluorescence of KIR2.1-Dendra2. (A,B) Summarized data of time-dependent recovery in green fluorescence (A) and decay of red fluorescence (B). Black boxes are for control (n = 14), and red circles, blue triangles, green triangles are for the data from the cells treated with Dyngo-4a (n = 15), Nocodazole (n = 20), Cytochalasin B (n = 17), respectively. (C,D) Summarized data of τ1 (C) and τ2 (D), fast and slow component of time constant for the recovery of green fluorescence after photoconversion, respectively. (E,F) Summarized data of τ1 (E) and τ2 (F), fast and slow component of time constant for the decay of red fluorescence after photoconversion, respectively. (A, inset) The maximum recovery rate of green fluorescence after photoconversion. *: p < 0.05 vs. control (one-way ANOVA).

