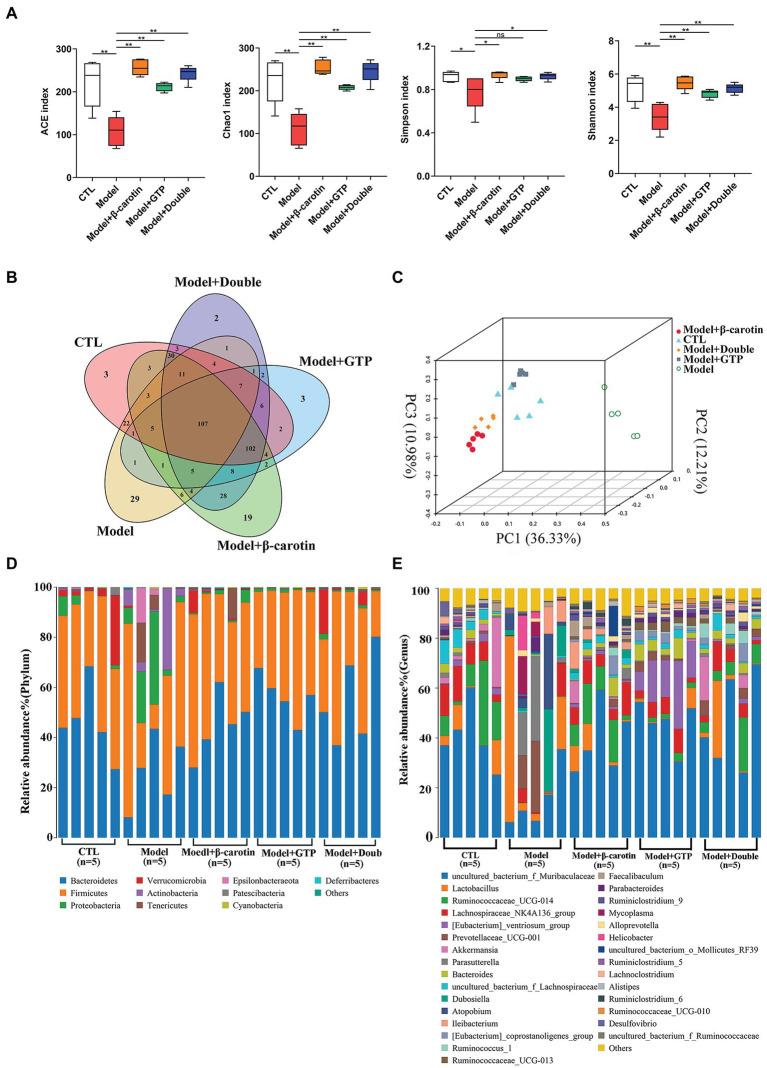
Figure 4.
Alterations in gut microbiota among five groups of mice. (A) Alpha diversity analysis. (B) Venn diagram of operational taxonomic units (OTUs). (C) Principal coordinate analysis (PCoA) of the gut microbiome. (D) Composition of the gut microbiota at the phylum level among the five groups of mice. (E) Composition of the gut microbiota at the genus level among the five groups of mice. *p < 0.05, **p < 0.01, and “ns” indicates no statistical significance.

