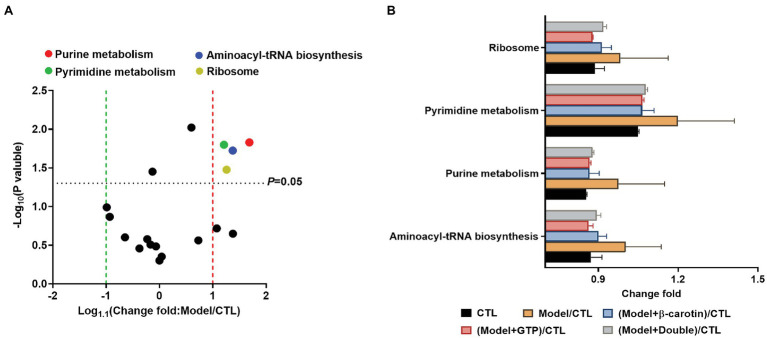
Figure 7.
Comparison of the relative abundance of the functional profiles of the gut microbiota based on PICRUSt among the five groups of mice. (A) Volcano plot analysis of altered Kyoto Encyclopedia of Genes and Genomes (KEGG) pathways with an average relative abundance >1% between the mice in CTL and Model groups. The p value is based on a two-tailed and paired t-test. (B) Distinct gene categories selected based on significant differences in gene categories at level 2 (t-test, p < 0.05).

