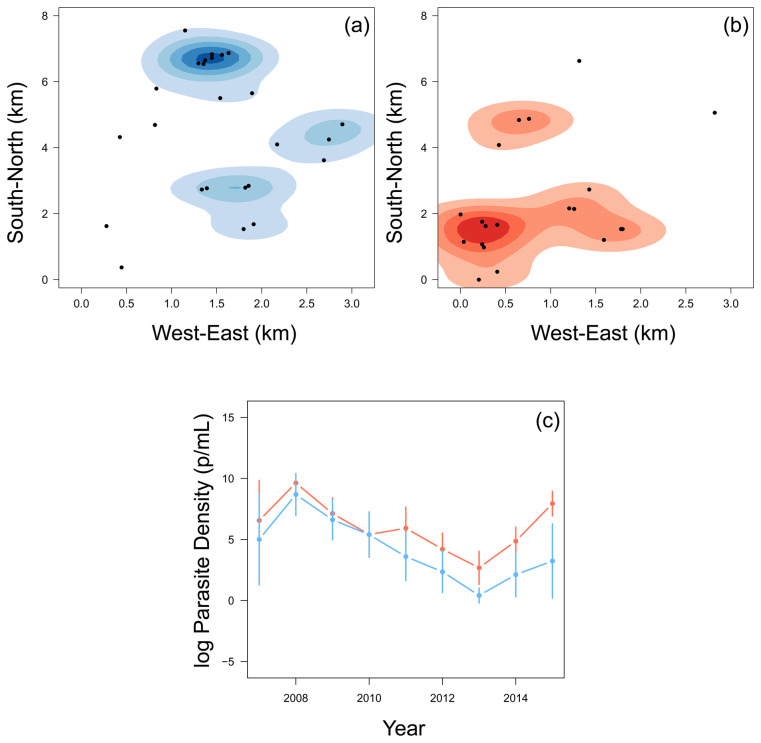
Figure 3.
A smoothed histogram of the location of children who experienced a malaria episode between the age of 13 and 15 in blue ( a) and plateaued in their episodes at the age of 12 in red ( b). The mean (+-95% confidence intervals) of the log parasite density of the annual cross-sectional survey for children who experienced a malaria episode between the age of 13 and 15 in blue and plateaued in their episodes by the age of 12 in red ( c).

