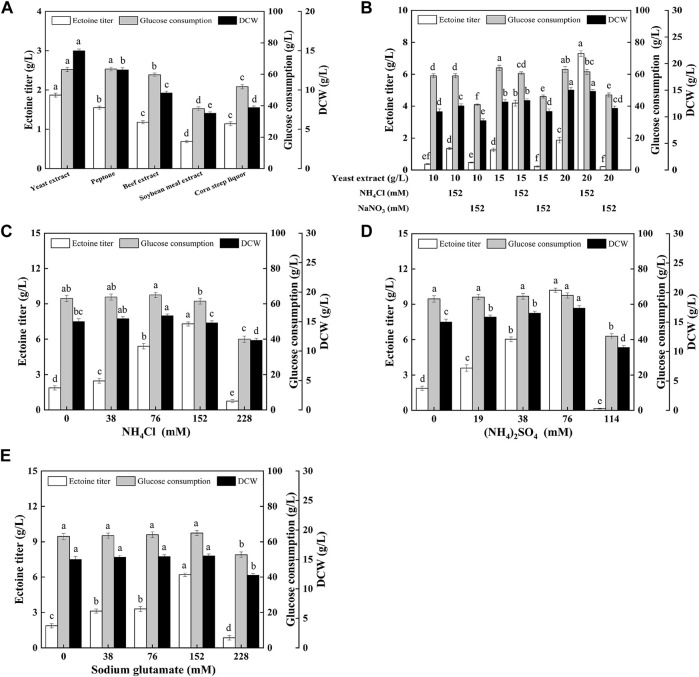
FIGURE 3.
Effects of (A) different organic nitrogen sources, (B) the yeast extract mixed with inorganic nitrogen, (C) different ammonium chloride concentrations, (D) different ammonium sulfate concentrations, (E) different sodium glutamate concentrations on ectoine production, glucose consumption, and cell growth in E. coli ET08. Values represent the mean ± SD. Statistical analysis was performed by Duncan’s test (p < 0.05). Different lowercase letters indicate significant differences.

