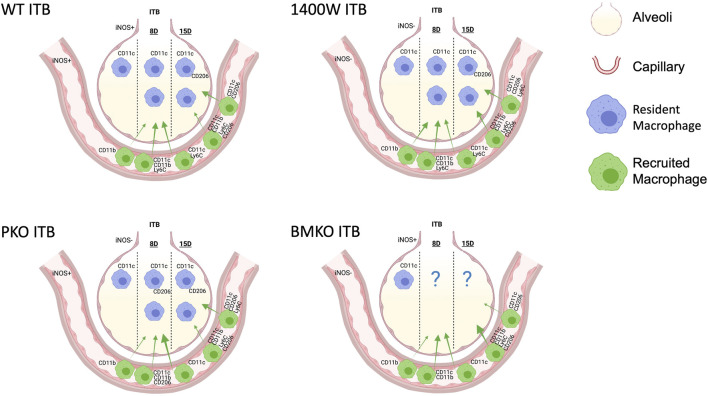
FIGURE 13.
A model to illustrate the macrophage populations 8 and 15 days following intratracheal instillation of bleomycin (ITB) in wild type mice, those treated with 1400 W, and iNOS chimeras. Macrophage populations vary in expression and relative distribution (demonstrated by arrow size) in response to iNOS competency. Created with Biorender.com.

