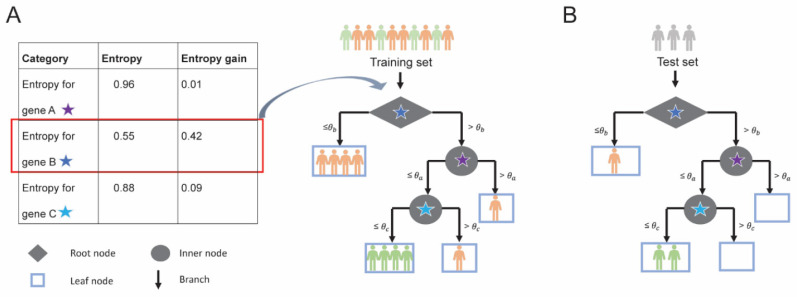
Fig. (3).
Training and testing of a decision tree; (A) Decision tree built using 3 genes A, B and C for 6 poor responders (patients in orange) and 4 good responders (patients in green). At a single expression threshold, entropy gain for each gene is calculated and gene with highest entropy gain is selected as a node for splitting. For example, entropy gain for each gene is calculated (Table, left) and gene B is selected as it has the highest entropy gain (highlighted in red) for the root node. The root node is denoted by a diamond and the intermediate nodes are denoted by a circle. At threshold θb, gene B splits (black arrows) the training set such that 6 patients have gene B expression less than or equal to threshold θb and the 4 patients have expression above threshold θb. All 4 patients with gene B expression less than or equal to threshold θb belong to the poor responder category and, therefore, are represented in leaf node (light blue rectangle). (B) The predictive ability of the decision tree model is evaluated using a test set. (A higher resolution / colour version of this figure is available in the electronic copy of the article).

