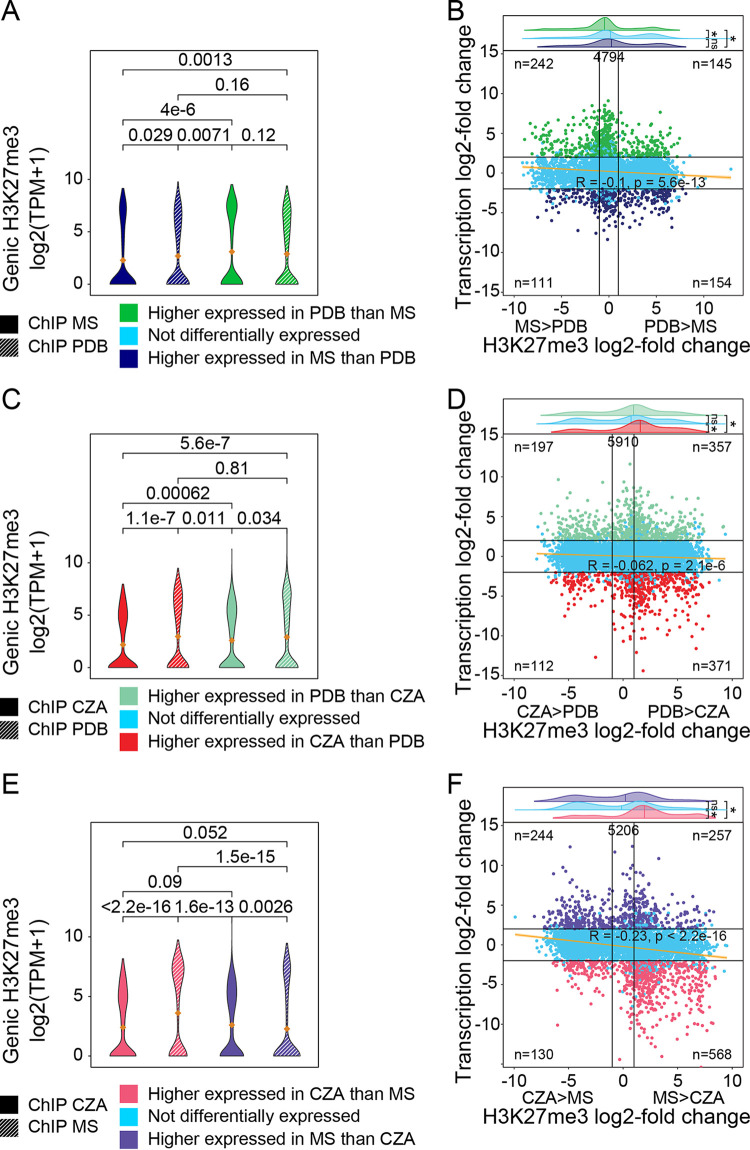
FIG 4.
Differentially expressed genes associated with local changes in H3K27me3 coverage. Shown are pairwise comparisons of input-corrected H3K27me3 coverage over differentially expressed genes for V. dahliae cultivated for 6 days in half-strength Murashige-Skoog medium (MS) and potato dextrose broth (PDB) (A and B), Czapek-Dox medium (CZA) and PDB (C and D), and MS and CZA (E and F). (A, C, and E) H3K27me3 coverage over differentially expressed genes in each corresponding growth medium. Mean values of violin plots are indicated with orange diamonds. (B, D, and F) Per-gene comparison of log2 fold changes in transcription and genic H3K27me3 coverage for genes with input-corrected H3K27me3 coverage of >0 in either or both of the compared media (the total number of genes is indicated at the top of the plot). Black horizontal lines indicate transcription log2 fold changes of −2 and 2, and black vertical lines indicate H3K27me3 log2 fold changes of −1 and 1. The numbers of genes in the four-corner section are indicated. Significant differences in TPM values between growth media or gene sets were determined by the one-sample Wilcoxon signed-rank test and are indicated by their P value or by asterisks (*, P ≤ 0.05).

