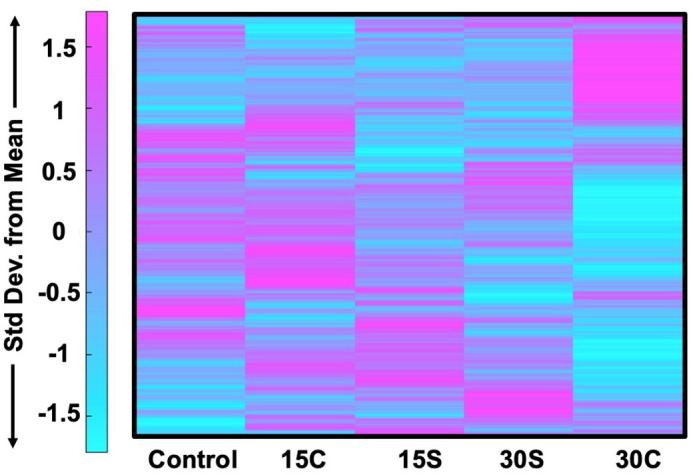
One way to view metabolomic data is by using heatmaps on platforms like MATLAB. Here, a median intensity heatmap of ∼1500 metabolite features from 30 different samples displays clusters of metabolite features that are unique to individual experimental groups. Next, metabolic pathways were identified, and biological relevance was determined. There's the saying “a picture is worth a thousand words”, they must've been talking about metabolomics!
