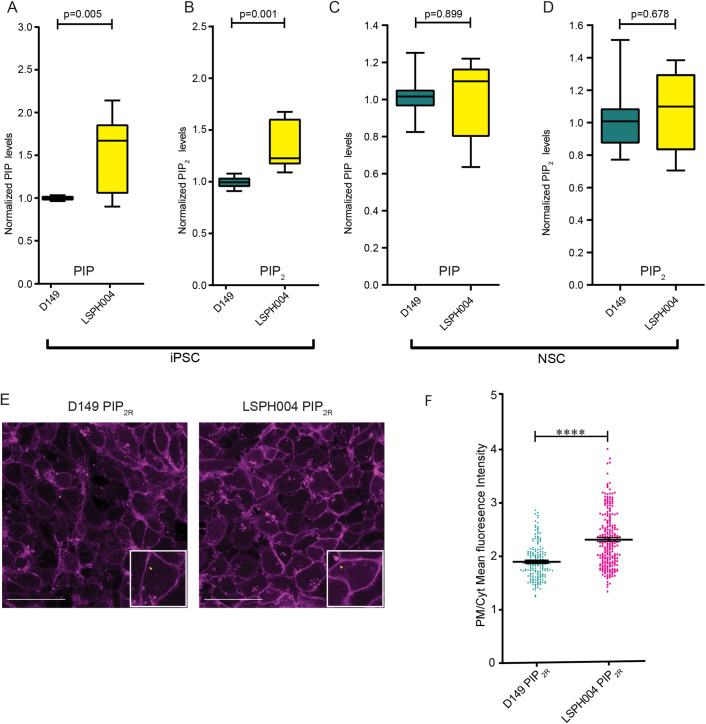
Fig. 4.
Mass spectrometry and biosensor estimation of PIP & PI(4,5)P2. (A) Box and Whisker Plot showing total PIP levels using LCMS in whole cell lipid extract from hiPSCs of Control (D149, n=9) and Patient lines (LSPH004, n=10). X-axis denoting samples and Y-axis represents normalized PIP levels. Statistical test: Two-tailed unpaired t-test with Welch's correction. Whiskers at minimum and maximum values and a line at the median. (B) Box and Whisker Plot showing total PIP2 levels using LCMS in whole cell lipid extract from hiPSCs of Control (D149, n=9) and Patient lines (LSPH004, n=10). X-axis denoting samples and Y-axis represents normalized PIP2 levels. Statistical test: Two-tailed unpaired t-test with Welch's correction. Whiskers at minimum and maximum values and a line at the median. (C) Box and Whisker Plot showing total PIP levels using LCMS in whole cell lipid extract from NSCs of Control (D149, n=12) and Patient line (LSPH004, n=12). X-axis denoting samples and Y-axis represents normalized PIP levels. Statistical test: Two-tailed unpaired t-test with Welch's correction. Whiskers at minimum and maximum values and a line at the median. (D) Total PIP2 levels using LCMS in whole cell lipid extract from NSCs of Control (D149, n=12) and Patient line (LSPH004, n=12). X-axis denoting samples and Y-axis represents normalized PIP levels. Statistical test: Two-tailed unpaired t-test with Welch's correction. Whiskers at minimum and maximum values and a line at the median. (E) Representative confocal maximum z-projections of mCherry::PH-PLCδ expressing PIP2 reporter lines used to estimate plasma membrane/cytosolic PIP2 probe fluorescence ratio (PM/Cyt). Enlarged insert shows mCherry::PH-PLCδ biosensor localization to the plasma membrane in a single cell. (F) Dot plot denoting quantification of PIP2 levels using mCherry::PH-PLCδ biosensor in Control (D149) and Patient (LSPH004) PIP2 reporter neural stem cell lines. X-axis denotes samples, Y-axis represents plasma membrane/cytosolic fluorescence ratio (PM/Cyt) of mCherry::PH-PLCδ biosensor. Each dot represents PM/Cyt obtained from a cell. Statistical test: Two-tailed unpaired t-test with Welch's correction. ****P-value <0.0001. Error bars: s.e.m.

