Fig. 5.
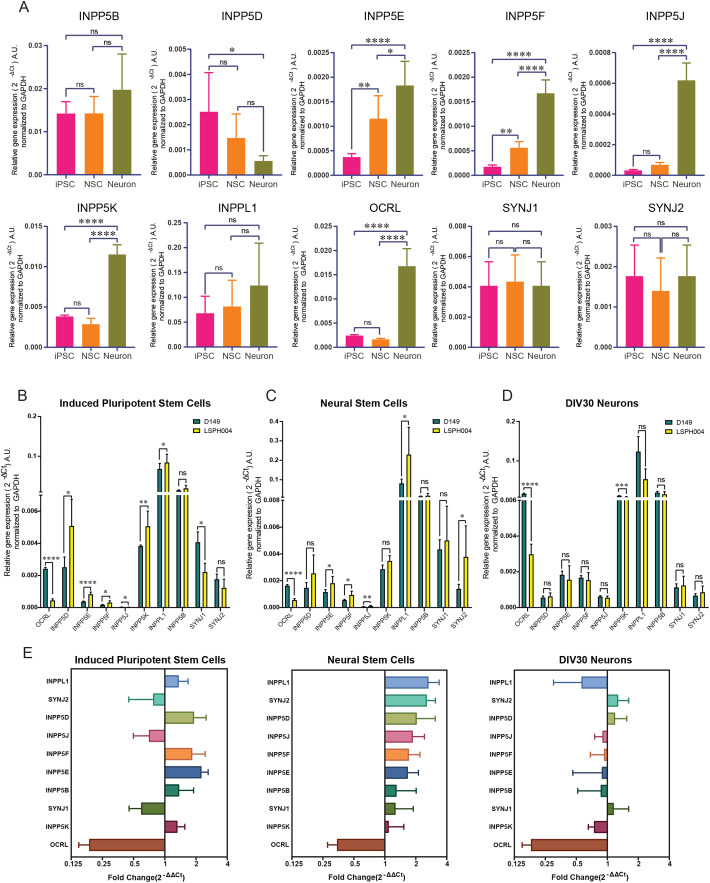
Expression analysis of inositol-5-phosphatase genes in hiPSC, NSC and 30 DIV neurons using qRT-PCR. (A) Quantitative real time PCR (qRT-PCR) showing mRNA expression of 10 inositol-5-phosphatases in the human genome. Data are shown for hiPSC, NSC and 30 DIV neurons in the D149 control line. Statistical test: one-way ANOVA with post hoc Tukey's multiple pairwise comparison. *P-value <0.05, **P-value <0.01, ****P-value <0.0001. Error bars: Standard deviation. (B–D) Relative mRNA expression levels of 10 inositol-5-phosphatases across hiPSC, NSC and 30 DIV neuron in D149 control line and LSPH004 patient line obtained from quantitative real time PCR (qRT-PCR). The expression levels have been normalized with GAPDH and the values represented in the terms of 2-ΔCt on Y-axis. Statistical test: Two-tailed unpaired t-test with Welch's correction. Error bars: Standard deviation. (E) Fold change in expression of 10 inositol-5-phosphatases across hiPSC, NSC and 30 DIV neurons in LSPH004 patient line relative to D149 obtained from quantitative real time PCR (qRT-PCR) using the 2-ΔΔCt method with GAPDH as a control gene. Error bars: Standard deviation.

