Fig. 1.
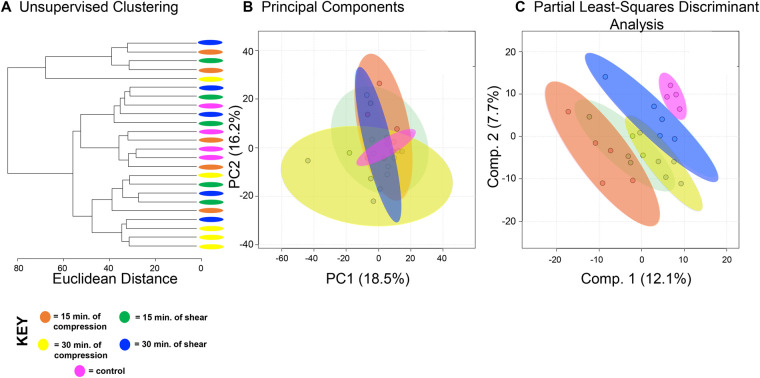
SW1353 chondrocytes have shared and distinct responses to shear and compressive forces. A total of 1457 metabolites were analyzed by both unsupervised hierarchical clustering (HCA) and principal component analysis (PCA) and supervised partial least-squares discriminant analysis (PLS-DA). (A) Unsupervised HCA visualized by a dendrogram did not distinguish distinct clusters between the five experimental groups (control, 15 min compression and shear, 30 min compression and shear). HCA assigns Euclidean distances to illustrate dissimilarity between samples and reveal clusters of samples with similar metabolomic profiles. (B) PCA, like HCA, did not display distinguished clusters between the five experimental groups. PCA is shown as a scatterplot with the first two PC on the x and y axes. The x axis shows PC1, which accounts for 18.3% of the variation in the dataset. PC2 is on the y axis and accounts for 14.2% of the variation in the dataset. (C) Supervised PLS-DA finds some separation between the five experimental groups, with similarity between different time points and different forces. PLS-DA is shown as a scatterplot of the top two components, with component 1 accounting for 14.6% and component 2 accounting for 7.6% of the variation in the dataset. The colors in A–C correspond to sample cohorts: pink, control; orange, 15 min compression; yellow, 30 min compression; green, 15 min shear; blue, 30 min shear. n=5 samples per group.

