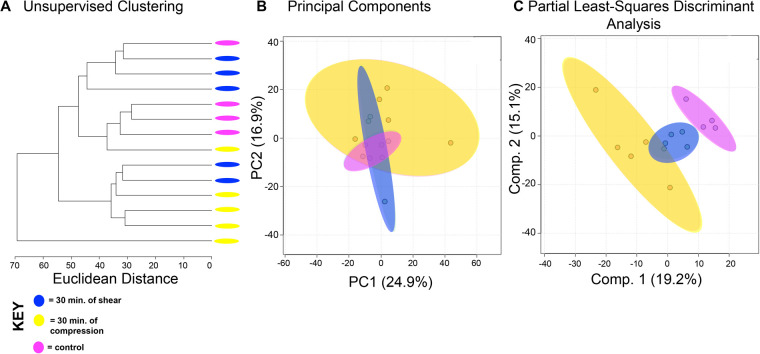
Fig. 5.
Metabolic profiles of differing forces with an equal exposure time of 30 min vary. Metabolomic profiles of chondrocytes exposed to compression and shear forces for 30 min display distinct metabolomic profiles. (A) Samples exposed to different forces for the same amount of time somewhat separate into clusters by HCA as illustrated in the dendrogram. (B) PCA displays clear clustering of samples within their respective cohorts: chondrocytes exposed to compression for 30 min (yellow) and chondrocytes exposed to shear forces for 30 min (blue). Control chondrocytes that were not exposed to mechanical stimuli is displayed for comparison purposes (pink). PCA is shown as a scatterplot of the first two PCs (PC1 and PC2), which account for 24.9% and 16.9% of the overall variation in the dataset, respectively. (C) PLS-DA finds clear separation between samples. PLS-DA is visualized as a scatterplot of the top two components, which account for 19.2% and 15.1% of the overall variation in the dataset. n=5 samples per group.

