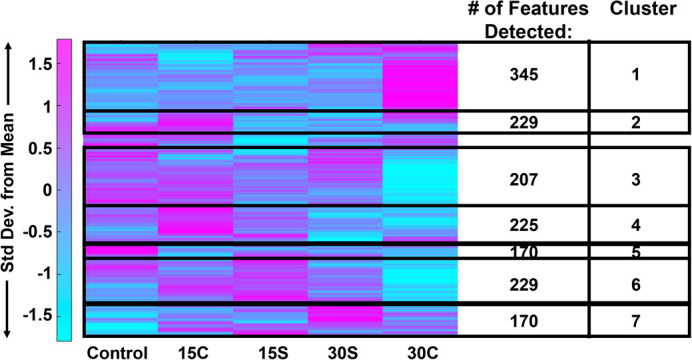
Fig. 6.

Heatmap analysis reveals that metabolic phenotypes differ when exposure time and mechanical force differ. Median intensities were clustered into five groups: control samples (n=4), 15 min of compression (n=5), 30 min of compression (n=5), 15 min of shear (n=5) and 30 min of shear force (n=5). 1457 metabolite intensities were detected in SW1353 cells. To determine associated pathways and metabolites, MS Peaks to Pathways was employed. Median values of n=5 samples per group.
