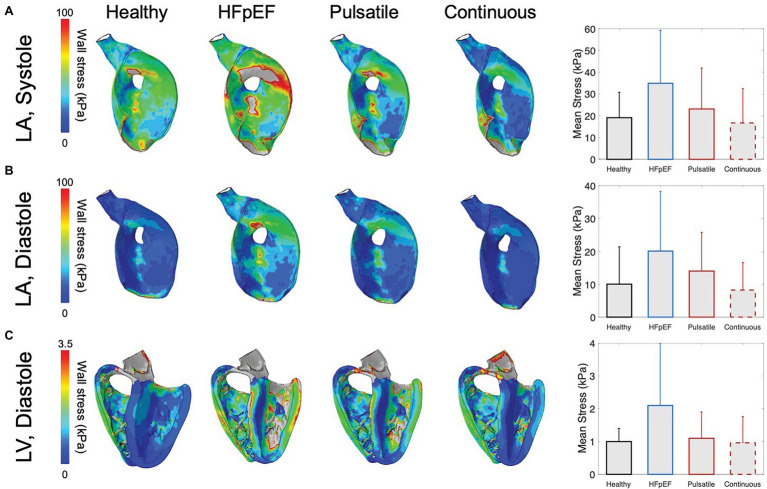
Figure 6.
Wall stress obtained by finite element analysis (FEA). Stress distribution of the left atrial (LA) wall (A) during systole and (B) diastole, and (C) of the left ventricular (LV) wall during diastole in the healthy heart, HFpEF, and under pulsatile and continuous support. The gray color in the contour plots represents the over values of the range (maximum color bar value). Bar charts illustrate corresponding mean stress values of active LV elements (~123,000 elements) during systole and diastole. Error bars indicate +1 standard deviation from the mean.

