
Figure 1.
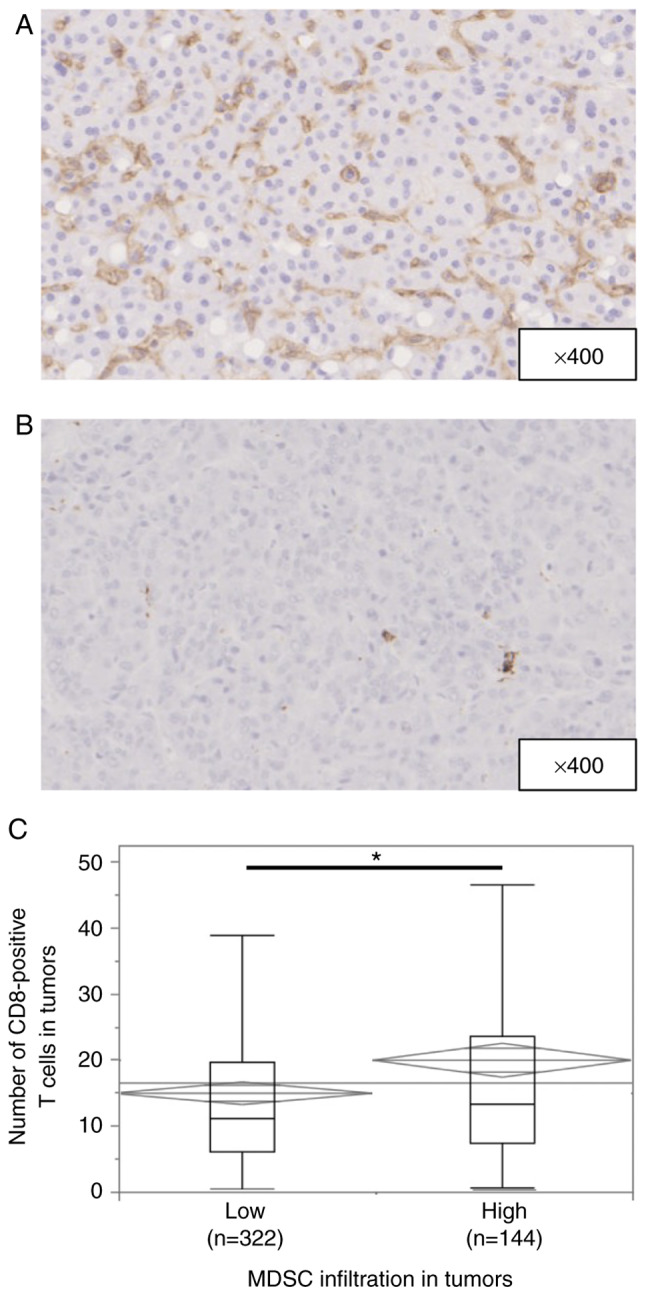
Immunohistochemical staining of MDSCs in patients with hepatocellular carcinoma. (A) Image of a high MDSC infiltration pattern. Magnification, ×400. (B) Image of a low MDSC infiltration pattern. Magnification, ×400. (C) Median numbers of intra-tumor CD8+ T cells in the high and low MDSC groups were 13.3 (range, 0.667-114) and 11.0 (range, 0.333-85.3), respectively (*P=0.0015). MDSC, myeloid-derived suppressor cell.