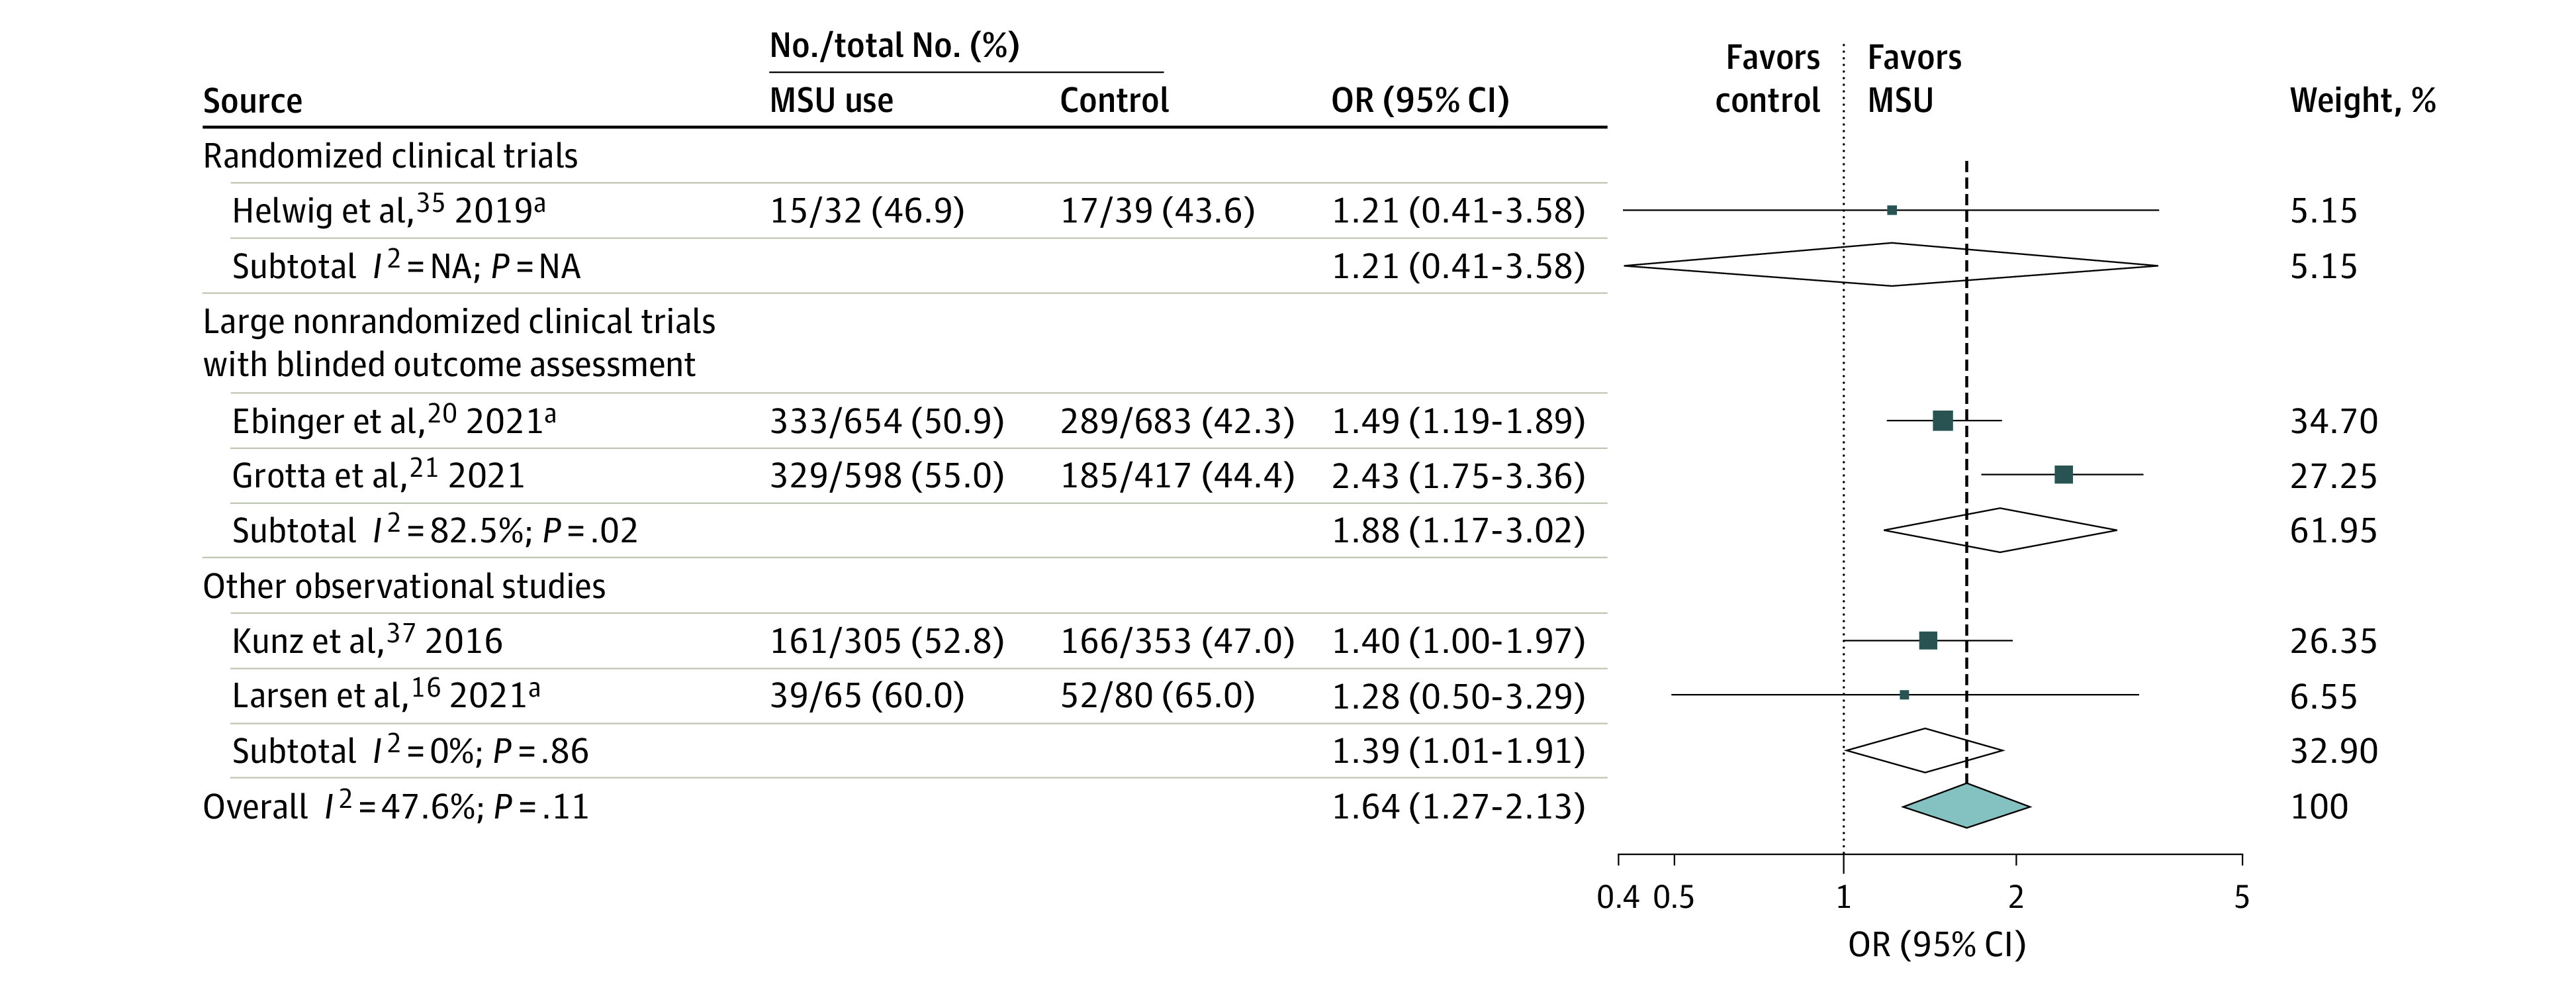
Figure 1. Pooled Adjusted Odds Ratio (OR) for Excellent Outcome at 90 Days (Modified Rankin Scale Score of 0 to 1) in Patients With Mobile Stroke Unit (MSU) Deployment vs Usual Care (Random-Effects Meta-analysis).

Results are expressed as number of patients with a modified Rankin Scale score of 0 to 1 divided by the total number of patients in each treatment group. Adjustment variables differed across studies (eTable 2 in the Supplement). The test for heterogeneity between subgroups was P = .39. NA indicates not applicable.
aPreviously unpublished data, excluding patients with stroke mimic in the study by Larsen et al.16 When including patients with stroke mimic, the adjusted OR for excellent outcome in the study by Larsen et al16 was 1.45 (95% CI, 0.60-3.51). Results from Helwig et al35 correspond to a post hoc analysis based on individual participant data, with adjustment on age and baseline National Institutes of Health Stroke Scale score.
