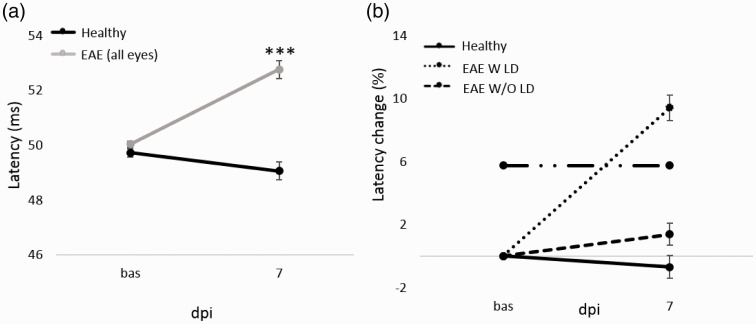
Figure 2.
VEP latency and VEP latency change (%) from baseline to 7 dpi. (a): VEP latency (ms) at baseline and 7 dpi in Healthy (n = 20 eyes) and EAE (n = 26 eyes). Pairwise comparisons of predicted marginal means were performed according to the concept of least‑squares means (***p < 0.0001). Error bars represent the SE. (b) VEP latency change (%) from baseline to 7 dpi in Healthy (n = 20 eyes), EAE W LD (n = 19 eyes) and EAE W/O LD (17 eyes). Dashed-dot line represents the cutoff value set at 5.76%. Error bars represent the SEM.

