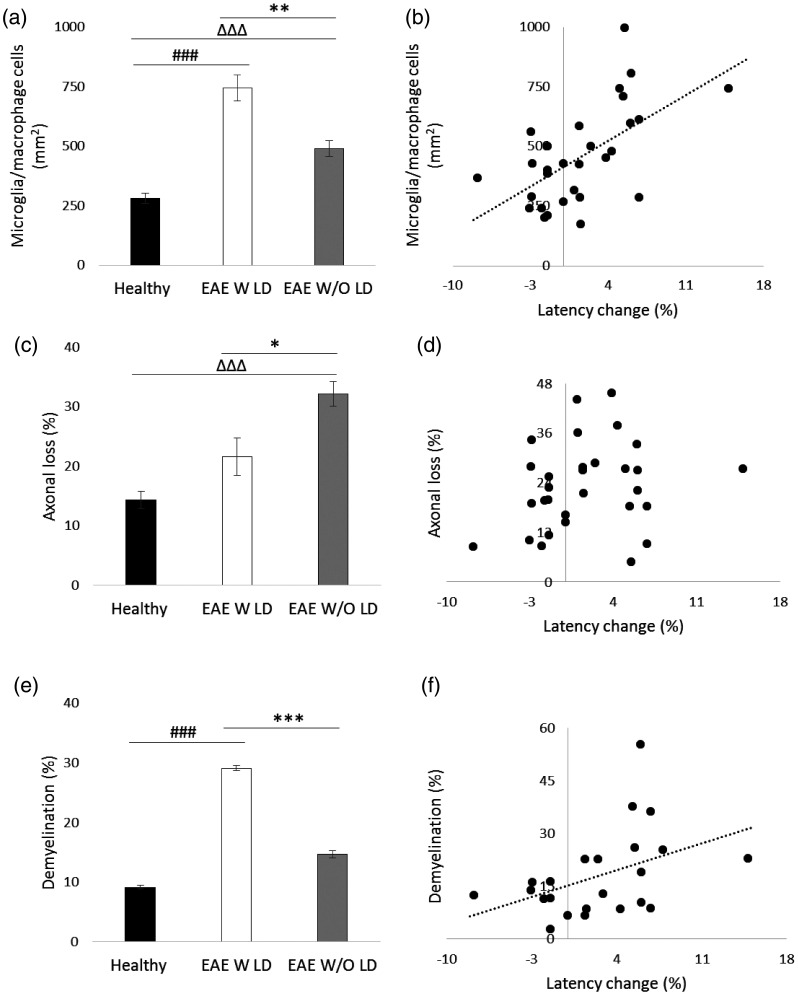
Figure 4.
Histological analysis of longitudinal optic nerve sections and correlations at 7 dpi. (a) Quantification of microglia/macrophage cells (mm2) in optic nerves stained with Iba 1. (b) Correlation between VEP latency change (%) and microglia/macrophage cells. (c) Quantification of axonal loss (%) in optic nerves stained with SMI 312. (d) Correlation between VEP latency change and axonal loss. (e) Quantification of demyelination (%) in optic nerves stained with LFB. (f) Correlation between VEP latency change and demyelination. (a, c, e) Healthy (black columns, n = 12 eyes); EAE W LD (white columns, n = 8 eyes); EAE W/O LD (grey columns, n = 12 eyes). Error bars represent the SE. Hashes represent significant differences between EAE W LD and Healthy; triangles represent significant differences between EAE W/O LD and Healthy; asterisks represent significant differences between EAE W LD and EAE W/O LD. (a, c, e) Pairwise comparisons of predicted marginal means were performed according to the concept of least‑squares means (*p < 0.01;**p < 0.001;***p < 0.0001). (b, d, f) Spearman’s correlations.

