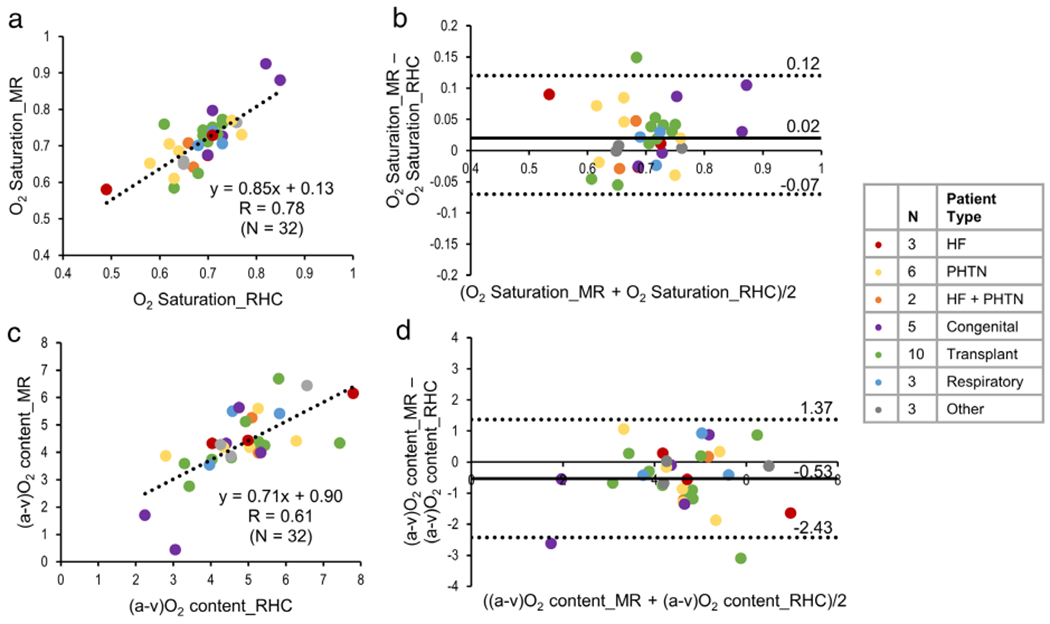
FIGURE 3:

Linear regression (a) and Bland–Altman (b) plots showing the comparison of O2 saturation estimated from MR oximetry against invasive RHC results. (c,d) The linear regression and Bland–Altman plots for (a-v)O2 difference (mL O2/100 mL of blood) estimated by MR against RHC. The Pearson correlation coefficient, R, is reported in (a,c). Specific patient pathologies are highlighted by the different colors.
