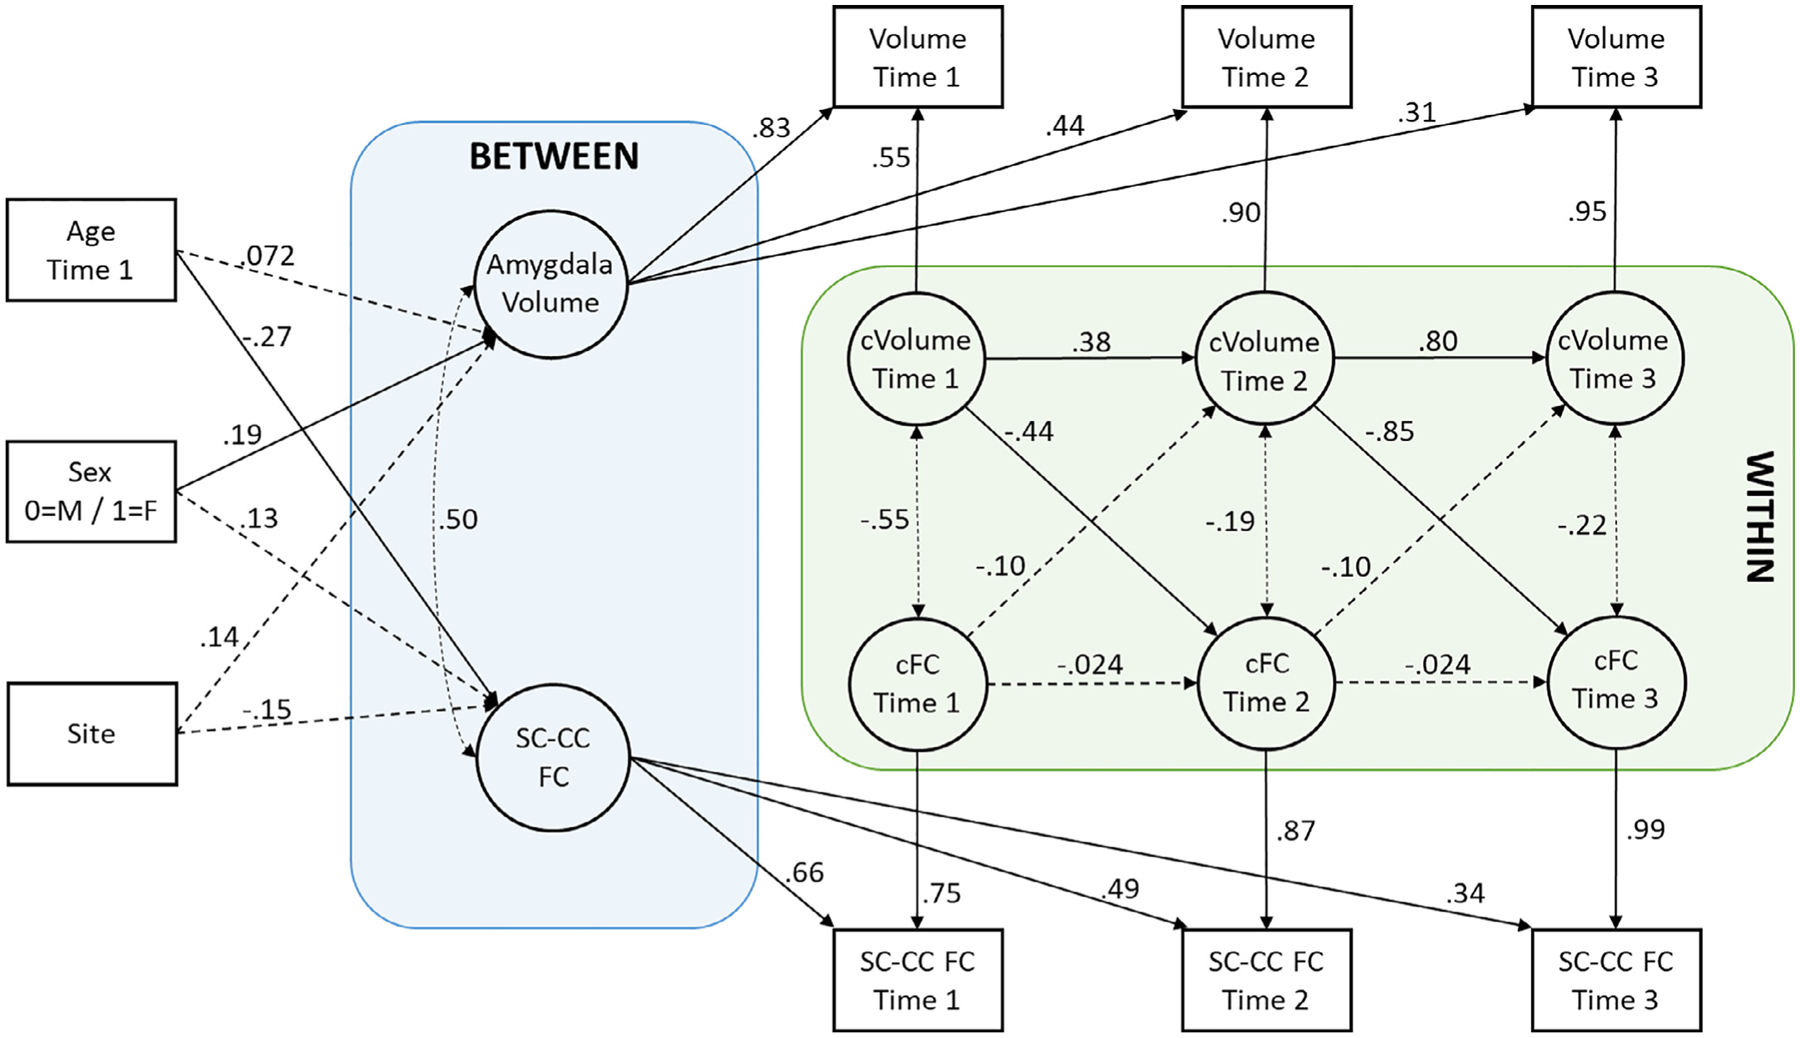
Fig. 2.

Results of the random-intercept cross-lagged panel model illustrating associations between amygdala volumes and between-network SC-CC connectivity controlling for age, sex (0 = “male”, 1 = “female”), and data collection site. All reported parameters are standardized coefficients. Solid lines indicate statistically significant relationships at the p < .05 level, whereas dashed lines indicate non-statistically significant relationships. Double-headed arrows show correlations, and single-headed arrows show predictive paths. “FC” = functional connectivity; “cFC” = centered within-person deviation in functional connectivity between the SC and CC networks; “cVolume” = centered within-person deviation in amygdala volume; squares represent manifest (observed) variables; circles represent latent variables.
