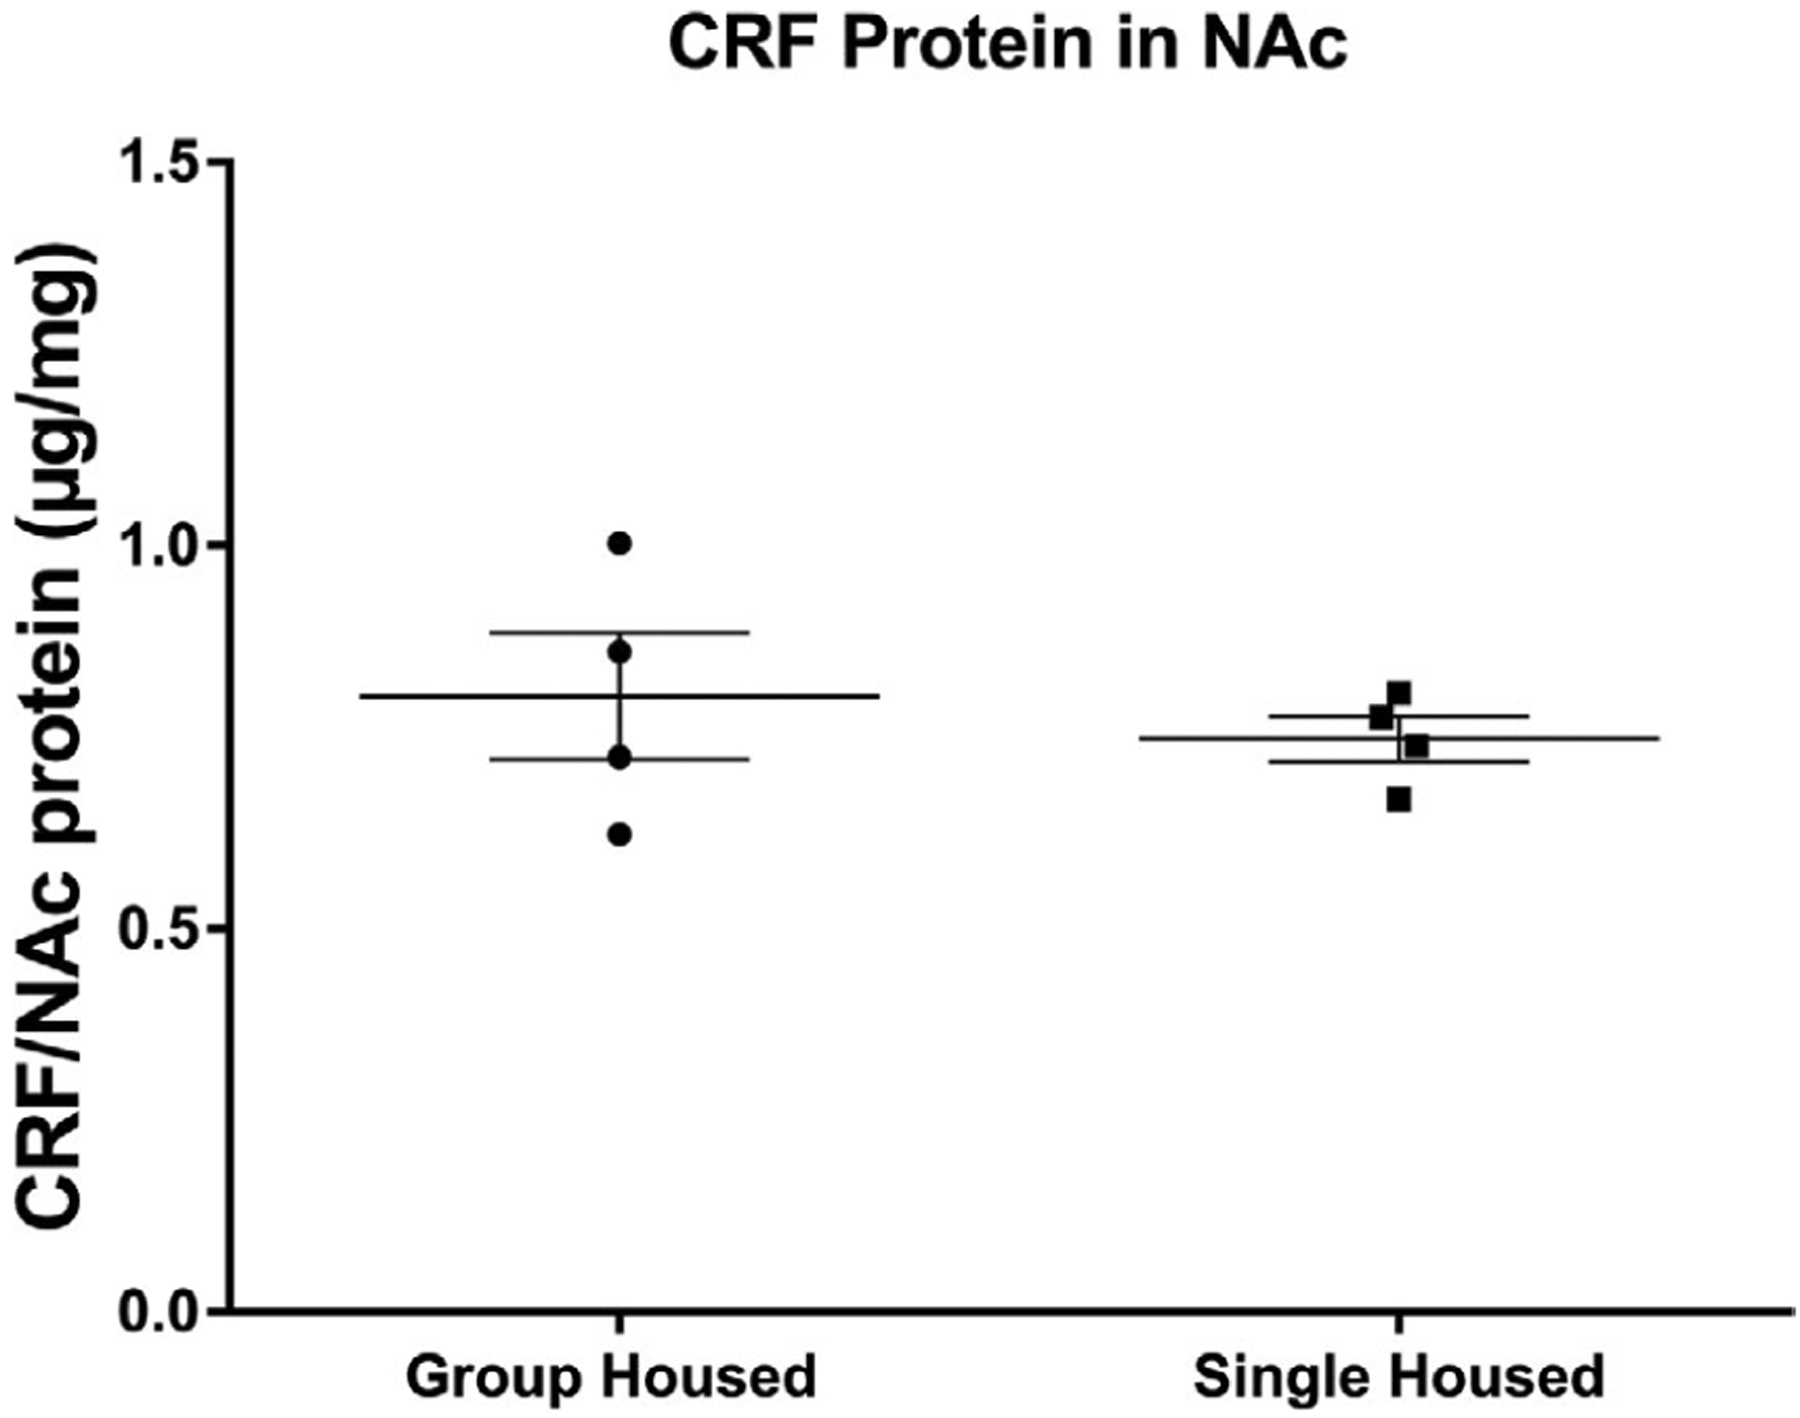
FIGURE 7.

Amount of CRF in the nucleus accumbens of single and group-housed rats. After 10 days of isolation, a separate group of rats was euthanized, the nucleus accumbens dissected and homogenized, and levels of CRF measured by ELISA. CRF in the NAc did not differ between single- and group-housed rats. Data presented as mean ± SEM, n = 4. CRF values were normalized with respect to total NAc proteins (see Table 1 for statistical values)
