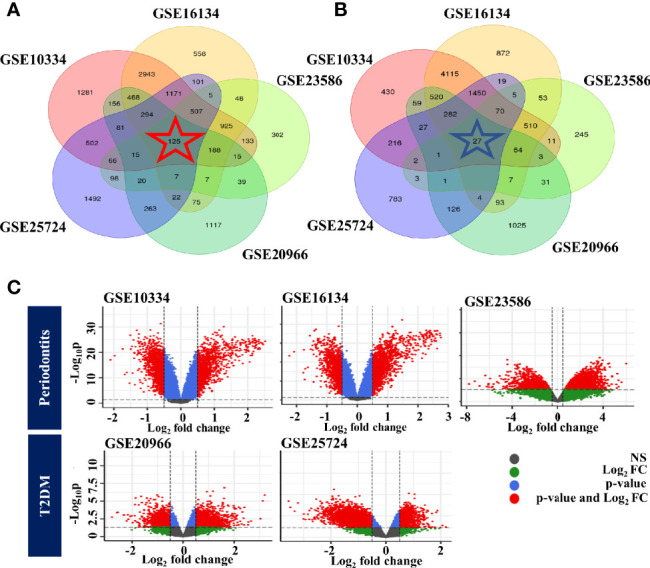
Figure 2.

Identification of common DEGs for each disease. (A) Venn diagram of upregulated genes. (B) Venn diagram of downregulated genes. (C) Volcano plot of DEGs identified in individual cohorts. The color of the points in the volcano plot indicates gray: not significant, green: passed only the log2 fold change, blue: passed only the p-value, red: passed the p-value and log2 fold change. PD, Below: T2DM.
