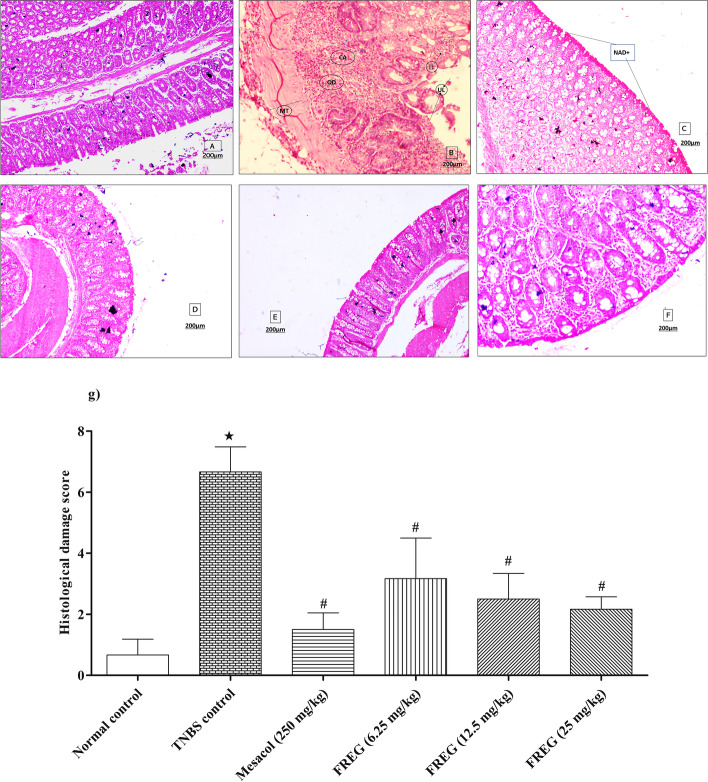
Fig. 6.
Effect of FREG on TNBS induced alterations in colon histopathology. Photomicrograph of sections of rat colon stained with H&E stain (A) Normal control: showing normal morphology (NAD+) (X100), (B) TNBS control: UL-Ulceration, II-Inflammatory infiltrate, CA-Crypt Abscess, OD-oedema, MT-Submucosal Thickening (X50), (C) Mesacol (250 mg/kg): showing normal morphology observed (NAD+) (X50), (D) FREG (6.25 mg/kg: showing normal morphology observed (NAD+) (X100), (E) FREG (12.5 mg/kg): showing normal morphology observed (NAD+) (X100), and (F) FREG (25 mg/kg): showing normal morphology observed (NAD+) (X100). (G) The quantitative representation of histological score. Data were expressed as the mean ± SD; n=6. ★P < 0.05 significantly different from normal control group. #P < 0.05 significantly different from TNBS control groups. Scale bar = 200 µm

