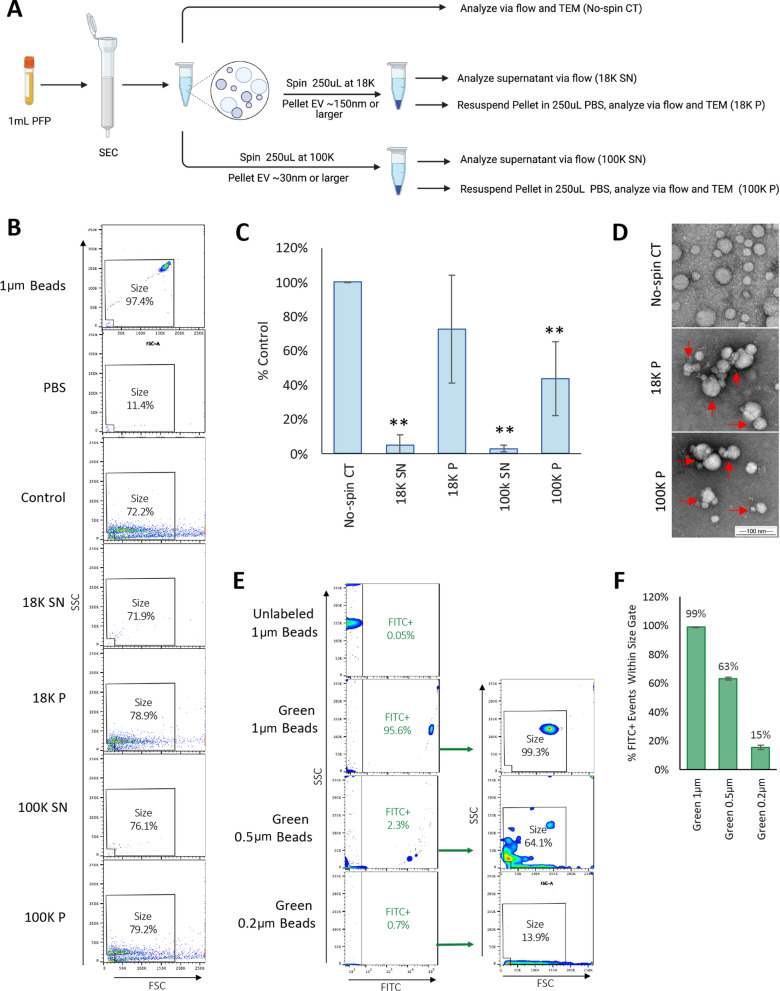
Fig. 2.
Determination of flow cytometry size resolution limits. A Schematic of experimental approach for high-speed centrifugation experiments. EV from 1 mL PFP were isolated in 1.5 mL PBS using SEC as described. A control aliquot (no spin CT) was immediately analyzed via flow cytometry and TEM. Equal portions of isolated EV in PBS (250 uL) were centrifuged at 18,000 g (18 K) or 100,000 g (100 K) for one h to pellet large EV (~ 150 and larger) or small EV (~ 30 nm and larger), respectively. Supernatants (SN) were harvested, and EV enumerated via flow. EV Pellets (P) were resuspended in 250 uL PBS and then analyzed via flow and TEM. B Representative dot plots for each condition using size gate. 1um beads (polystyrene microspheres) and PBS are shown as controls. C Counts were normalized to no-spin controls and expressed as percent control. Results represent the mean ± STDEV of four separate donors. ** p < 0.01 versus control determined by one-way ANOVA with post-hoc Tukey HSD Test. D TEM analysis of EV in no-spin controls or after resuspension from 18 and 100 K pellets. Red arrows point to EV aggregates observed in resuspended EV pellets. E Flow cytometry analysis of unlabeled 1, 0.5, and 0.2 μm green-fluorescent beads (polystyrene microspheres). Unlabeled 1 μm beads were used as negative controls. Events positive for green fluorescence measured on the FITC channel (FITC +) were analyzed using the size gate determined in previous experiments. F Quantification of the percentage of FITC + events detected within the size gate. Results represents the mean ± STDEV of three replicates

