Fig. 4.
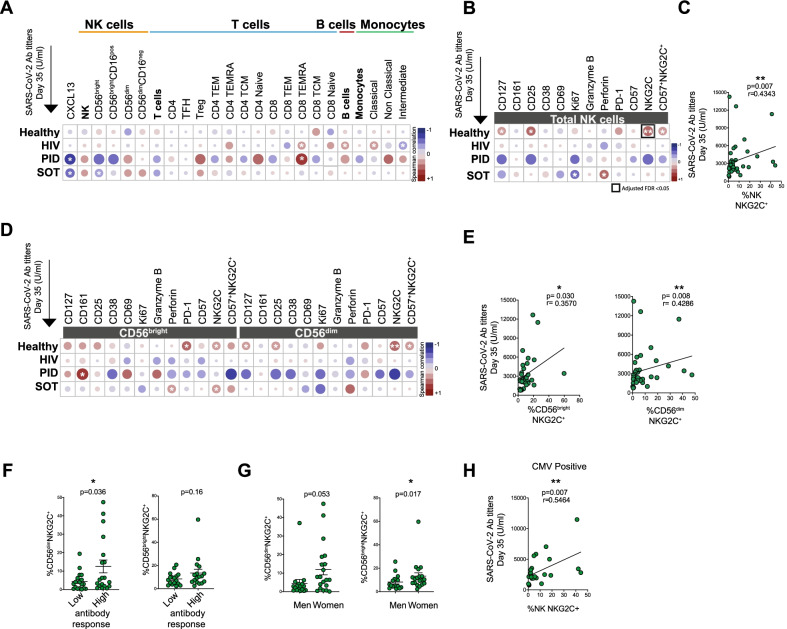
NK cell immune phenotypic characterization at baseline and its correlation to anti-SARS-CoV-2 Ab titers. A Heatmap displaying Spearman correlations between different lymphocytic (NK, T and B cells and their subsets), monocytic cell subsets, and markers expressed on total NK cells at baseline (Day 0) and anti-SARS-CoV-2 Ab titers at Day 35 in healthy study subjects and immunocompromised patients. Heatmaps depicting Spearman correlation between the expression of immune phenotypical markers at Day 0 on total NK cells (B), CD56bright and CD56dim cells D in healthy study subjects and immunocompromised patients, and the anti-SARS-CoV-2 Ab levels at Day 35. Spearman correlation between the NKG2C expression at Day 0 on total NK cells (C), CD56bright and CD56dim cells E in healthy study subjects and anti-SARS-CoV-2 Ab titers at Day 35 (n = 37). For the heatmaps diplaying Spearman correlation, false discovery rate (FDR) corrections were performed using the Benjamini–Hochberg test at an FDR < 0.05 significance threshold. Frequencies of NKG2C positive cells among CD56dim and CD56bright NK cells in healthy study subjects stratified into individuals with lower (50%) or higher (50%) anti-SARS-Cov-2 Ab titers F and in men and women G (n = 37). H Spearman correlation between the NKG2C expression at Day 0 on total NK cells and anti-SARS-CoV-2 Ab titers at Day 35 (n = 26) in healthy study subjects with a positive CMV serostatus. For Figs. 4A, B, D: Healthy individuals (n = 39), PLWH (n = 48), PID (n = 12), SOT (n = 34). For C and E Healthy individuals (n = 39). Mann–Whitney U test used to evaluate differences between two groups. Color in heatmaps indicates the r value, i.e. the strength of the correlation from the Spearman test, and asterisks show the statistical p value followed by FDR correction (highlighted in a black square if < 0.05). Significance level: *p < 0.05, **p < 0.01, ***p < 0.001

