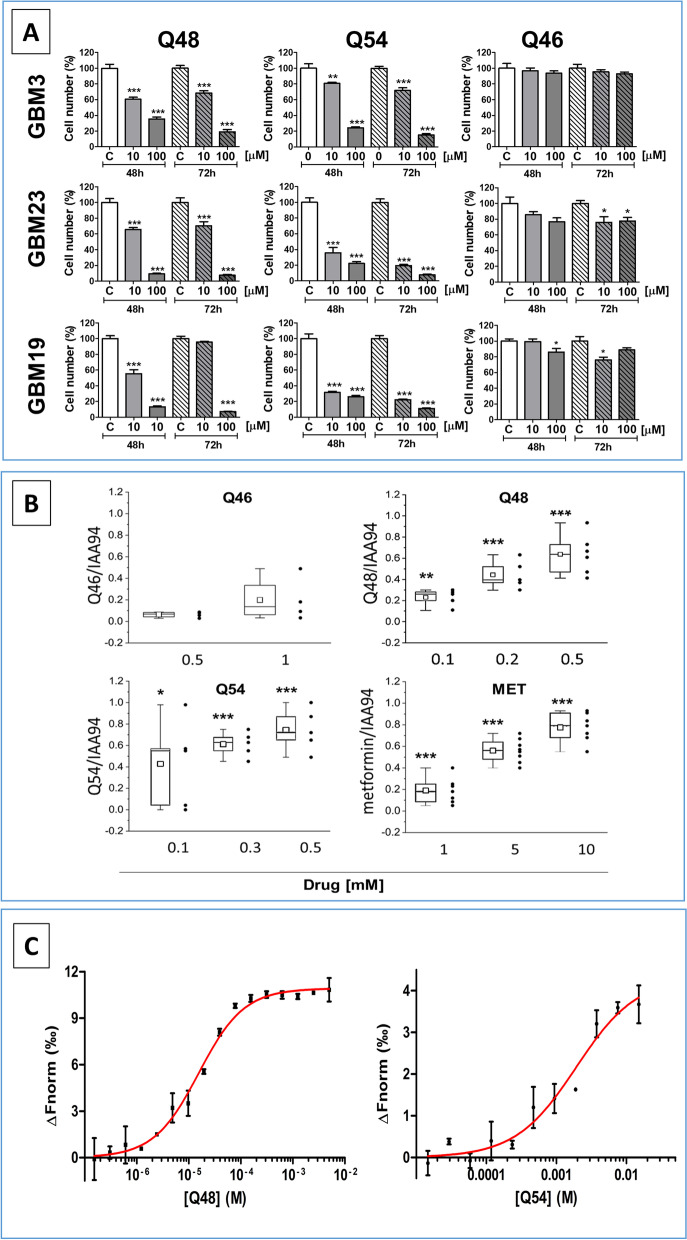
Fig. 2.
A Antiproliferative activity of Q48, Q54, and Q46 biguanide derivatives in GSCs, evaluated by live cell counting. Cell proliferation of GBM3, 19 and 23, treated with Q48, Q54 and Q46 at 10 and 100 μM concentrations was evaluated counting live cells by Trypan-blue exclusion, 48-72 h post-treatment. Data represent the mean ± S.E.M. of 3 independent experiments performed in quadruplicate. Direct cell counting confirmed the high efficacy and potency of Q48 and Q54. Q46, used as negative control, was ineffective. *p < 0.05, **p < 0.01, ***p < 0.001 vs. respective control (CTR). B Effect of novel biguanide derivatives on CLIC1-mediated ion current in GSCs. CLIC1-mediated ion current was evaluated by whole cell patch clamp electrophysiology measurement in voltage-clamp configuration in GBM3. Cell were sequentially perfused with vehicle (controls), Q46 (0.5–1 mM), Q48 (0.1–0.5 mM), Q54 (0.1–0.5 mM) and metformin (1–10 mM), followed by IAA94 (100 μM) to identify CLIC1 residual activity, in current time-course experiments. Box chart plots report the mean current inhibition as ratio of the biguanide and IAA94 sensitive currents. IAA94 treatment represents the residual CLIC1 activity. Grey dots, next to box charts, indicate the number of cells used for the statistics (range 4–8) for each drug concentration. *p < 0.05, **p < 0.01, ***p < 0.001 vs. respective control cells. C Microscale Thermophoresis (MST) analysis of CLIC1 binding by novel biguanide compounds. MST analysis of Q48 (left) and Q54 (right) binding to CLIC1. Titration curve of RED-NHS-labelled CLIC1 (10 nM) with increasing concentrations of novel compounds. MST data are the average of three replicates. The sigmoidal fitting curve, obtained using GraphPad Prism 5.0 software, is shown in red

