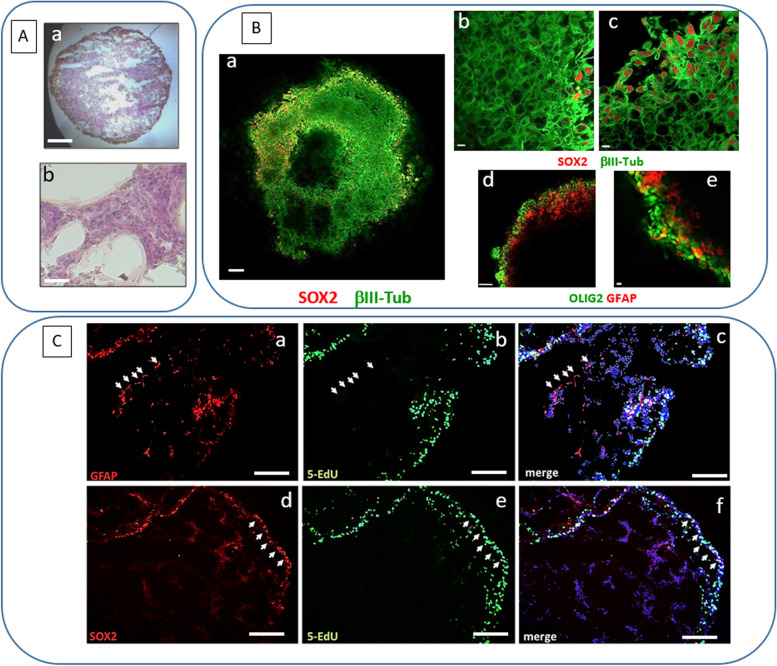
Fig. 4.
Characterization of GSC 3D organoids. A Hematoxylin & eosin staining of GSC organoid sections, after 3 weeks of cultures: cells are organized in a tissue-like layered structure. a: bar = 500 μm; b: bar = 50 μm. B Immunofluorescence images of the whole GSC organoid structure labelled with Sox2 (red) and β-III tubulin (green) (a: bar = 100 μm; b and c: bar = 10 μm), or Olig2 (green) and GFAP (red) (d: bar = 100 μm; e: bar = 10 μm) obtained by confocal microscopy. Cells expressing stem cell markers, Sox2 and Olig2, display a peripheral localization as compared to differentiated cells expressing β-III tubulin and GFAP. C Immunofluorescent labelling for GFAP (red, upper pictures) and Sox2 (red, lower pictures) performed on slices of GSC organoids after 3 weeks of cultures, incubated with 5-EdU (green), to mark actively proliferating cells. Nuclei are counterstained with DAPI (blue). White arrows highlight that most proliferating cells are Sox2-positive and localized at the periphery of the organoid; conversely, most GFAP-positive cells display an inner localization and are not co-labelled by 5-EdU. Bar = 200 μm

